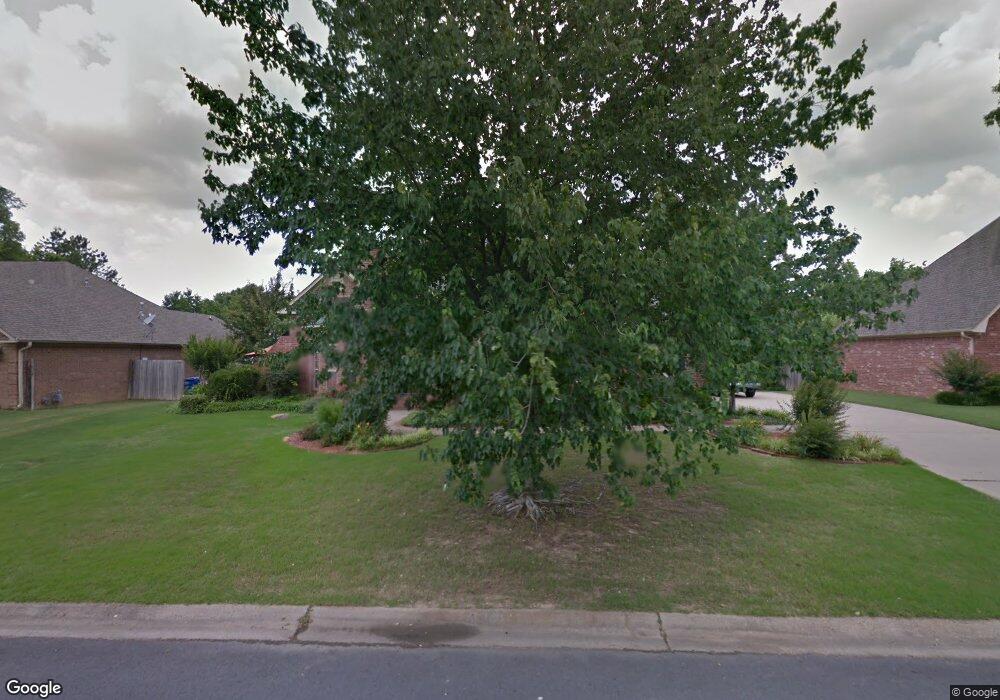
2990 Crawford Loop Conway, AR 72034
Downtown Conway NeighborhoodEstimated Value: $386,953 - $436,000
Studio
3
Baths
2,565
Sq Ft
$159/Sq Ft
Est. Value
About This Home
This home is located at 2990 Crawford Loop, Conway, AR 72034 and is currently estimated at $408,738, approximately $159 per square foot. 2990 Crawford Loop is a home located in Faulkner County with nearby schools including Julia Lee Moore Elementary School, Conway Junior High School, and Conway High School.
Ownership History
Date
Name
Owned For
Owner Type
Purchase Details
Closed on
Jul 31, 2006
Bought by
Sherrod
Current Estimated Value
Home Financials for this Owner
Home Financials are based on the most recent Mortgage that was taken out on this home.
Original Mortgage
$235,000
Outstanding Balance
$139,283
Interest Rate
6.62%
Mortgage Type
New Conventional
Estimated Equity
$269,455
Purchase Details
Closed on
Jul 28, 2006
Sold by
Miller Kennith B and Miller Desiree S
Bought by
Sherrod Robert A and Sherrod Jennifer L
Home Financials for this Owner
Home Financials are based on the most recent Mortgage that was taken out on this home.
Original Mortgage
$235,000
Outstanding Balance
$139,283
Interest Rate
6.62%
Mortgage Type
New Conventional
Estimated Equity
$269,455
Purchase Details
Closed on
Jul 18, 2002
Bought by
Miller
Purchase Details
Closed on
Mar 10, 1994
Bought by
Torian
Create a Home Valuation Report for This Property
The Home Valuation Report is an in-depth analysis detailing your home's value as well as a comparison with similar homes in the area
Home Values in the Area
Average Home Value in this Area
Purchase History
| Date | Buyer | Sale Price | Title Company |
|---|---|---|---|
| Sherrod | $235,000 | -- | |
| Sherrod Robert A | $235,000 | Conway Title Service | |
| Sherrod | $235,000 | -- | |
| Miller | $200,000 | -- | |
| Torian | $24,000 | -- |
Source: Public Records
Mortgage History
| Date | Status | Borrower | Loan Amount |
|---|---|---|---|
| Open | Sherrod Robert A | $235,000 |
Source: Public Records
Tax History
| Year | Tax Paid | Tax Assessment Tax Assessment Total Assessment is a certain percentage of the fair market value that is determined by local assessors to be the total taxable value of land and additions on the property. | Land | Improvement |
|---|---|---|---|---|
| 2025 | $3,238 | $80,280 | $5,200 | $75,080 |
| 2024 | $3,091 | $80,280 | $5,200 | $75,080 |
| 2023 | $2,943 | $58,170 | $5,200 | $52,970 |
| 2022 | $2,532 | $58,170 | $5,200 | $52,970 |
| 2021 | $2,400 | $58,170 | $5,200 | $52,970 |
| 2020 | $2,268 | $52,240 | $5,200 | $47,040 |
| 2019 | $2,268 | $52,240 | $5,200 | $47,040 |
| 2018 | $2,293 | $52,240 | $5,200 | $47,040 |
| 2017 | $2,293 | $52,240 | $5,200 | $47,040 |
| 2016 | $2,293 | $52,240 | $5,200 | $47,040 |
| 2015 | $2,588 | $51,140 | $5,600 | $45,540 |
| 2014 | $2,238 | $51,140 | $5,600 | $45,540 |
Source: Public Records
Map
Nearby Homes
- 1945 Columbia Dr
- 2960 Craighead Cir
- 1930 Columbia Dr
- 3020 Ashley Dr
- 1715 Royal Dr
- 1810 Royal Dr
- 2125 Desha Dr
- 2960 Windamere Dr
- 1660 Chicot Dr
- 1655 Chicot Dr
- 41 Tucker Creek Rd
- 3335 Nicklaus Dr
- 11 Red Oak Dr
- 2 Pin Oak Dr
- 10 Forrest Ln
- 2525 Winchester Dr
- 15 Brierwood Cir
- 4 Riviera Dr
- 1 Cedar Oaks Dr
- 15 Covewood Dr
- 2980 Crawford Loop
- 3000 Crawford Loop
- 2995 Franklin Cir
- 2985 Crawford Loop
- 2995 Crawford Loop
- 3005 Franklin Cir
- 3010 Crawford Loop
- 3015 Franklin Cir
- 2970 Crawford Loop
- 3005 Crawford Loop
- 2985 Franklin Cir
- 2975 Crawford Loop
- 2975 Franklin Cir
- 2960 Crawford Loop
- 3020 Crawford Loop
- 2965 Crawford Loop
- 3015 Crawford Loop
- 1910 Payne Ln
- 2980 Dallas Loop
- 2965 Franklin Cir
Your Personal Tour Guide
Ask me questions while you tour the home.