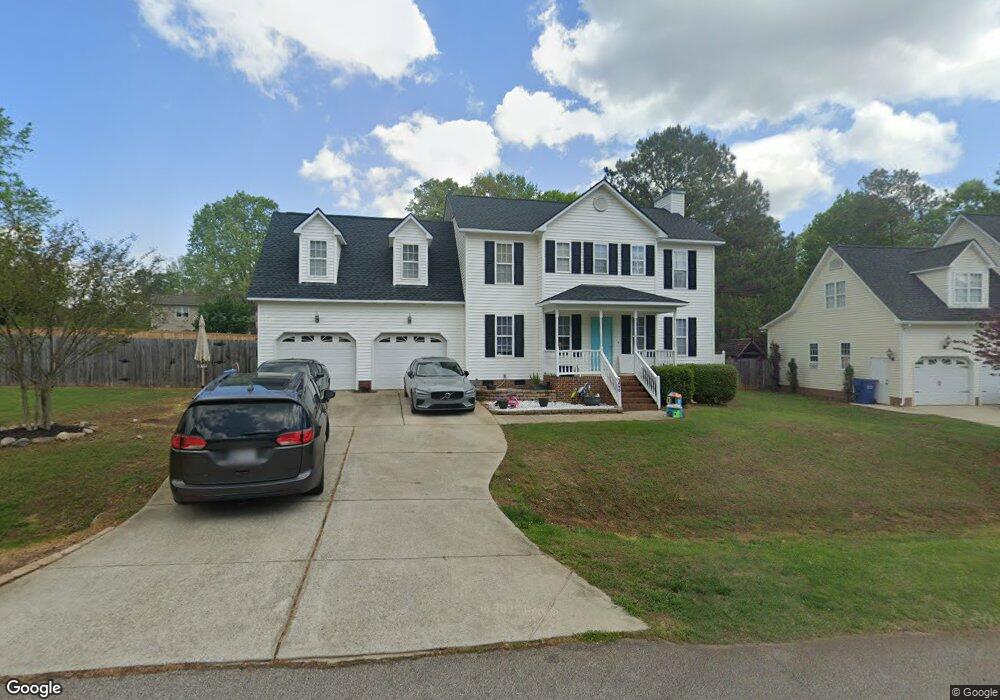
2990 Deep Glen Ct Raleigh, NC 27603
Estimated Value: $426,000 - $523,000
3
Beds
3
Baths
2,350
Sq Ft
$193/Sq Ft
Est. Value
About This Home
This home is located at 2990 Deep Glen Ct, Raleigh, NC 27603 and is currently estimated at $453,677, approximately $193 per square foot. 2990 Deep Glen Ct is a home located in Wake County with nearby schools including Banks Road Elementary School.
Ownership History
Date
Name
Owned For
Owner Type
Purchase Details
Closed on
Jul 27, 2016
Sold by
Mcwade Kristin
Bought by
Hallin Shawn and Hallin Erika
Current Estimated Value
Home Financials for this Owner
Home Financials are based on the most recent Mortgage that was taken out on this home.
Original Mortgage
$218,025
Outstanding Balance
$174,295
Interest Rate
3.54%
Mortgage Type
New Conventional
Estimated Equity
$279,382
Purchase Details
Closed on
Jan 30, 2008
Sold by
Mcwade Kristin and Mcwade Christopher James
Bought by
Mcwade Kristin
Purchase Details
Closed on
Mar 9, 2005
Sold by
Comfort Homes Inc
Bought by
Mcwade Christopher and Zering Kela
Home Financials for this Owner
Home Financials are based on the most recent Mortgage that was taken out on this home.
Original Mortgage
$168,050
Interest Rate
5.6%
Mortgage Type
Fannie Mae Freddie Mac
Create a Home Valuation Report for This Property
The Home Valuation Report is an in-depth analysis detailing your home's value as well as a comparison with similar homes in the area
Home Values in the Area
Average Home Value in this Area
Purchase History
| Date | Buyer | Sale Price | Title Company |
|---|---|---|---|
| Hallin Shawn | $230,000 | None Available | |
| Mcwade Kristin | -- | First American Title Ins | |
| Mcwade Christopher | $177,000 | -- |
Source: Public Records
Mortgage History
| Date | Status | Borrower | Loan Amount |
|---|---|---|---|
| Open | Hallin Shawn | $218,025 | |
| Previous Owner | Mcwade Christopher | $168,050 |
Source: Public Records
Tax History Compared to Growth
Tax History
| Year | Tax Paid | Tax Assessment Tax Assessment Total Assessment is a certain percentage of the fair market value that is determined by local assessors to be the total taxable value of land and additions on the property. | Land | Improvement |
|---|---|---|---|---|
| 2025 | $2,657 | $412,238 | $80,000 | $332,238 |
| 2024 | $2,580 | $412,238 | $80,000 | $332,238 |
| 2023 | $2,033 | $258,161 | $42,000 | $216,161 |
| 2022 | $1,884 | $258,161 | $42,000 | $216,161 |
| 2021 | $1,834 | $258,161 | $42,000 | $216,161 |
| 2020 | $1,804 | $258,161 | $42,000 | $216,161 |
| 2019 | $1,761 | $213,165 | $38,000 | $175,165 |
| 2018 | $1,620 | $213,165 | $38,000 | $175,165 |
| 2017 | $1,536 | $213,165 | $38,000 | $175,165 |
| 2016 | $1,505 | $213,165 | $38,000 | $175,165 |
| 2015 | $1,342 | $190,345 | $38,000 | $152,345 |
| 2014 | $1,272 | $190,345 | $38,000 | $152,345 |
Source: Public Records
Map
Nearby Homes
- 10329 Fanny Brown Rd
- 5216 Relay Way
- 1117 Leach St
- 2704 Stageline Dr
- 3205 Banks Rd
- 5512 Glenhurst North Dr
- 1425 Tawny View Ln
- 1200 Misty Morning Way
- 10917 Stage Dr
- 1017 Widgeon Way
- 9008 Chelsea Dr
- 1220 Turner Woods Dr
- 3320 Highgate Rd
- 2600 Banks Rd Unit Lot 2
- 2600 Banks Rd Unit Lot 1
- 4008 Bankshire Ln
- 4012 Sorrell Brothers Ct
- 1005 Turner Meadow Dr
- 936 Elbridge Dr
- 9045 Chelsea Dr
- 2986 Deep Glen Ct
- 1077 Alderman Cir
- 1073 Alderman Cir
- 2991 Deep Glen Ct
- 2982 Deep Glen Ct
- 1085 Alderman Cir
- 5228 Turning Branch Ln
- 5224 Turning Branch Ln
- 2987 Deep Glen Ct
- 5230 Turning Branch Ln
- 1069 Alderman Cir
- 2976 Deep Glen Ct
- 2977 Deep Glen Ct
- 5209 Turning Branch Ln
- 1089 Alderman Cir
- 5234 Turning Branch Ln
- 5235 Turning Branch Ln
- 2968 Deep Glen Ct
- 1086 Alderman Cir
- 2973 Deep Glen Ct