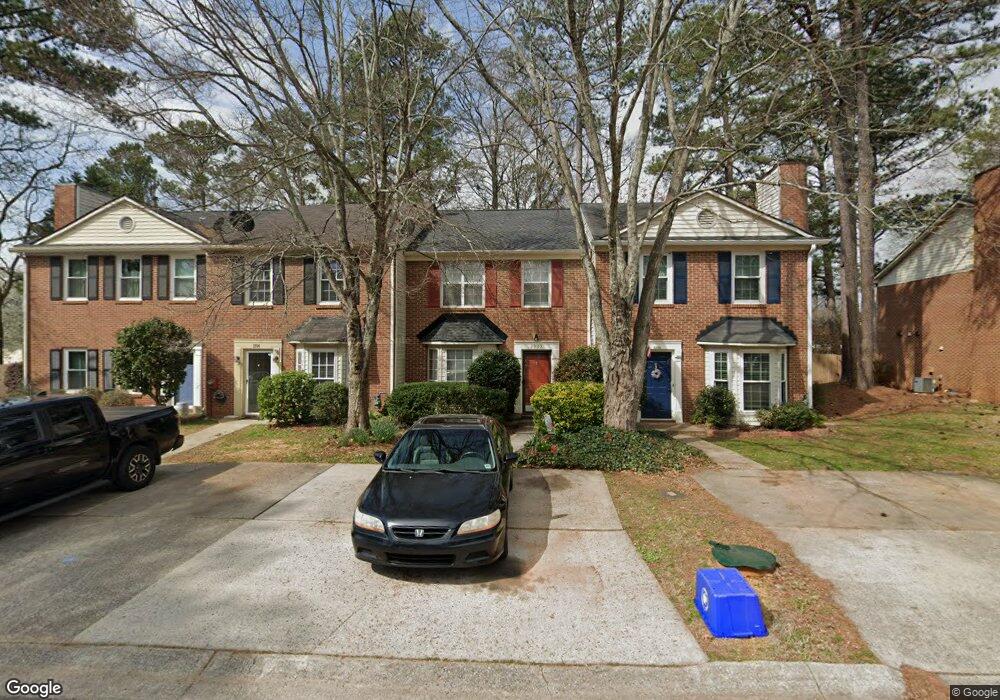
2992 Lexington Trace Dr SE Unit 2 Smyrna, GA 30080
Estimated Value: $288,000 - $307,000
2
Beds
3
Baths
1,452
Sq Ft
$204/Sq Ft
Est. Value
About This Home
This home is located at 2992 Lexington Trace Dr SE Unit 2, Smyrna, GA 30080 and is currently estimated at $296,447, approximately $204 per square foot. 2992 Lexington Trace Dr SE Unit 2 is a home located in Cobb County with nearby schools including Smyrna Elementary School, Campbell Middle School, and Campbell High School.
Ownership History
Date
Name
Owned For
Owner Type
Purchase Details
Closed on
Nov 9, 2007
Sold by
Brantly Susan L
Bought by
Kellerman Virginia E
Current Estimated Value
Home Financials for this Owner
Home Financials are based on the most recent Mortgage that was taken out on this home.
Original Mortgage
$143,200
Interest Rate
6.15%
Mortgage Type
New Conventional
Purchase Details
Closed on
Aug 28, 2002
Sold by
Castillo Margarita A
Bought by
Brantly Susan L
Home Financials for this Owner
Home Financials are based on the most recent Mortgage that was taken out on this home.
Original Mortgage
$149,400
Interest Rate
5.25%
Mortgage Type
New Conventional
Purchase Details
Closed on
May 31, 2000
Sold by
Prewett Robert G and Prewett Courtney P
Bought by
Castillo Margarita A
Home Financials for this Owner
Home Financials are based on the most recent Mortgage that was taken out on this home.
Original Mortgage
$111,850
Interest Rate
8.27%
Mortgage Type
FHA
Create a Home Valuation Report for This Property
The Home Valuation Report is an in-depth analysis detailing your home's value as well as a comparison with similar homes in the area
Home Values in the Area
Average Home Value in this Area
Purchase History
| Date | Buyer | Sale Price | Title Company |
|---|---|---|---|
| Kellerman Virginia E | $179,000 | -- | |
| Brantly Susan L | $169,400 | -- | |
| Castillo Margarita A | $115,200 | -- |
Source: Public Records
Mortgage History
| Date | Status | Borrower | Loan Amount |
|---|---|---|---|
| Previous Owner | Kellerman Virginia E | $143,200 | |
| Previous Owner | Brantly Susan L | $149,400 | |
| Previous Owner | Castillo Margarita A | $111,850 |
Source: Public Records
Tax History Compared to Growth
Tax History
| Year | Tax Paid | Tax Assessment Tax Assessment Total Assessment is a certain percentage of the fair market value that is determined by local assessors to be the total taxable value of land and additions on the property. | Land | Improvement |
|---|---|---|---|---|
| 2025 | $2,407 | $112,948 | $34,000 | $78,948 |
| 2024 | $2,407 | $112,948 | $34,000 | $78,948 |
| 2023 | $1,918 | $112,948 | $34,000 | $78,948 |
| 2022 | $2,285 | $105,384 | $20,000 | $85,384 |
| 2021 | $1,915 | $85,216 | $20,000 | $65,216 |
| 2020 | $1,915 | $85,216 | $20,000 | $65,216 |
| 2019 | $1,704 | $74,144 | $18,000 | $56,144 |
| 2018 | $1,503 | $64,624 | $18,000 | $46,624 |
| 2017 | $1,246 | $58,248 | $12,000 | $46,248 |
| 2016 | $1,056 | $50,876 | $12,800 | $38,076 |
| 2015 | $730 | $37,528 | $8,000 | $29,528 |
| 2014 | $738 | $37,528 | $0 | $0 |
Source: Public Records
Map
Nearby Homes
- 2999 Jonquil Dr SE
- 1801 Lochlomand Ln SE
- 1837 Lochlomand Ln SE
- 1836 Lochlomand Ln SE
- 1552 Mosaic Way
- 1560 Mosaic Way
- 1582 Mosaic Way Unit 1582
- 1903 Lochlomand Ln SE
- 1652 Mosaic Way
- 2791 Madison St SE
- 1913 Heathridge Ct SE
- 1303 Vinings Forest Ln SE
- 1203 Vinings Forest Ln SE Unit 12
- 2964 Anderson Cir SE
- 3064 Montclair Cir SE
- 1876 Balmoral Rd SE
- 1097 Creatwood Cir SE
- 1567 Paces Ferry North Dr SE
- 2861 Bernard Ln SE
- 1799 Timber Valley Way SE
- 2990 Lexington Trace Dr SE
- 2994 Lexington Trace Dr SE Unit 2
- 2996 Lexington Trace Dr SE
- 2980 Lexington Trace Dr SE
- 2976 Lexington Trace Dr SE
- 2976 Lexington Trace Dr SE
- 2978 Lexington Trace Dr SE
- 2993 Lexington Trace Dr SE
- 2974 Lexington Trace Dr SE Unit 2974
- 2974 Lexington Trace Dr SE
- 2974 Lexington Trace Dr SE Unit 2
- 2995 Lexington Trace Dr SE Unit 2
- 2997 Lexington Trace Dr SE
- 2991 Lexington Trace Dr SE Unit 2
- 2995 Emory Rd SE
- 2972 Lexington Trace Dr SE Unit 40
- 2972 Lexington Trace Dr SE
- 2975 Emory Rd SE
- 2999 Lexington Trace Dr SE
- 2979 Lexington Trace Dr SE