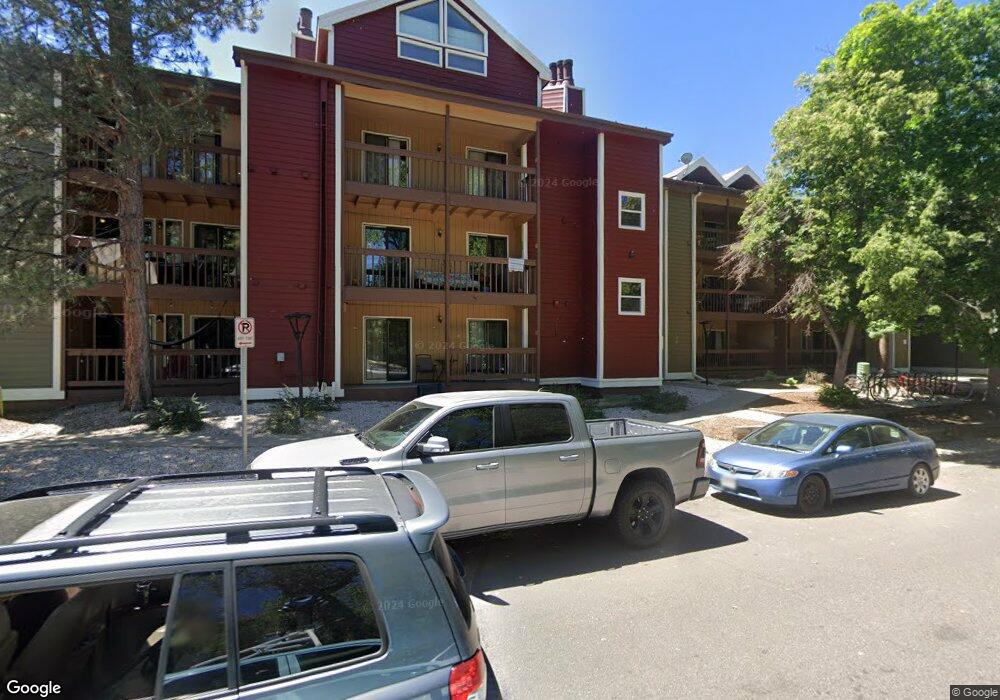
2992 Shadow Creek Dr Unit 210 Boulder, CO 80303
University of Colorado Boulder Area NeighborhoodEstimated Value: $366,207 - $482,000
1
Bed
1
Bath
754
Sq Ft
$572/Sq Ft
Est. Value
About This Home
This home is located at 2992 Shadow Creek Dr Unit 210, Boulder, CO 80303 and is currently estimated at $431,302, approximately $572 per square foot. 2992 Shadow Creek Dr Unit 210 is a home located in Boulder County with nearby schools including Creekside Elementary School, Manhattan Middle School of the Arts & Academics, and Fairview High School.
Ownership History
Date
Name
Owned For
Owner Type
Purchase Details
Closed on
Apr 30, 2008
Sold by
Osmus Matthew
Bought by
Cuppari Brigitte
Current Estimated Value
Purchase Details
Closed on
Dec 31, 2005
Sold by
Osmus Dallas J and Osmus Bonita K
Bought by
Osmus Matthew
Purchase Details
Closed on
Jun 28, 1996
Sold by
Hartmann Philipp Mark
Bought by
Osmus Dallas J
Home Financials for this Owner
Home Financials are based on the most recent Mortgage that was taken out on this home.
Original Mortgage
$86,400
Interest Rate
8.02%
Purchase Details
Closed on
Apr 8, 1996
Sold by
Walter Harold
Bought by
Hartmann Philipp Mark
Purchase Details
Closed on
Oct 14, 1994
Sold by
Hartmann Philipp Mark
Bought by
Walter Harold
Purchase Details
Closed on
Jul 27, 1992
Bought by
Cuppari Brigitte
Create a Home Valuation Report for This Property
The Home Valuation Report is an in-depth analysis detailing your home's value as well as a comparison with similar homes in the area
Home Values in the Area
Average Home Value in this Area
Purchase History
| Date | Buyer | Sale Price | Title Company |
|---|---|---|---|
| Cuppari Brigitte | $198,000 | Landamerica | |
| Osmus Matthew | -- | None Available | |
| Osmus Dallas J | $108,000 | Title Services Inc | |
| Hartmann Philipp Mark | -- | -- | |
| Walter Harold | -- | Commonwealth Land Title Ins | |
| Cuppari Brigitte | $68,000 | -- |
Source: Public Records
Mortgage History
| Date | Status | Borrower | Loan Amount |
|---|---|---|---|
| Previous Owner | Osmus Dallas J | $86,400 |
Source: Public Records
Tax History Compared to Growth
Tax History
| Year | Tax Paid | Tax Assessment Tax Assessment Total Assessment is a certain percentage of the fair market value that is determined by local assessors to be the total taxable value of land and additions on the property. | Land | Improvement |
|---|---|---|---|---|
| 2025 | $1,260 | $23,506 | -- | $23,506 |
| 2024 | $1,260 | $23,506 | -- | $23,506 |
| 2023 | $1,238 | $21,038 | -- | $24,723 |
| 2022 | $1,229 | $20,183 | $0 | $20,183 |
| 2021 | $1,172 | $20,764 | $0 | $20,764 |
| 2020 | $1,110 | $19,906 | $0 | $19,906 |
| 2019 | $1,706 | $19,906 | $0 | $19,906 |
| 2018 | $1,592 | $18,360 | $0 | $18,360 |
| 2017 | $1,542 | $21,420 | $0 | $21,420 |
| 2016 | $1,444 | $16,676 | $0 | $16,676 |
| 2015 | $1,367 | $14,734 | $0 | $14,734 |
| 2014 | $1,267 | $14,734 | $0 | $14,734 |
Source: Public Records
Map
Nearby Homes
- 2960 Shadow Creek Dr Unit 101
- 2902 Shadow Creek Dr Unit 204
- 2865 Sundown Ln Unit 108
- 2802 Sundown Ln Unit 102
- 2800 Sundown Ln Unit 109
- 3000 Colorado Ave Unit F122
- 3000 Colorado Ave Unit D114
- 3000 Colorado Ave Unit 122F
- 3000 Colorado Ave Unit B206
- 2801 Pennsylvania Ave Unit 203
- 3009 Madison Ave Unit M-315
- 2850 E College Ave Unit 110
- 2510 Taft Dr Unit 312
- 2510 Taft Dr Unit 205
- 3401 Arapahoe Ave Unit 309
- 3301 Arapahoe Ave Unit 405
- 3301 Arapahoe Ave Unit 107
- 3601 Arapahoe Ave Unit 408
- 905 36th St
- 805 29th St Unit 253
- 2992 Shadow Creek Dr Unit 312
- 2992 Shadow Creek Dr Unit 311
- 2992 Shadow Creek Dr Unit 310
- 2992 Shadow Creek Dr Unit 303
- 2992 Shadow Creek Dr Unit 302
- 2992 Shadow Creek Dr Unit 301
- 2992 Shadow Creek Dr Unit 212
- 2992 Shadow Creek Dr Unit 211
- 2992 Shadow Creek Dr Unit 202
- 2992 Shadow Creek Dr Unit 201
- 2992 Shadow Creek Dr Unit 112
- 2992 Shadow Creek Dr Unit 111
- 2992 Shadow Creek Dr Unit 110
- 2992 Shadow Creek Dr Unit 103
- 2992 Shadow Creek Dr Unit 102
- 2992 Shadow Creek Dr
- 2990 Shadow Creek Dr Unit 309
- 2990 Shadow Creek Dr Unit 308
- 2990 Shadow Creek Dr Unit 307
- 2990 Shadow Creek Dr Unit 306