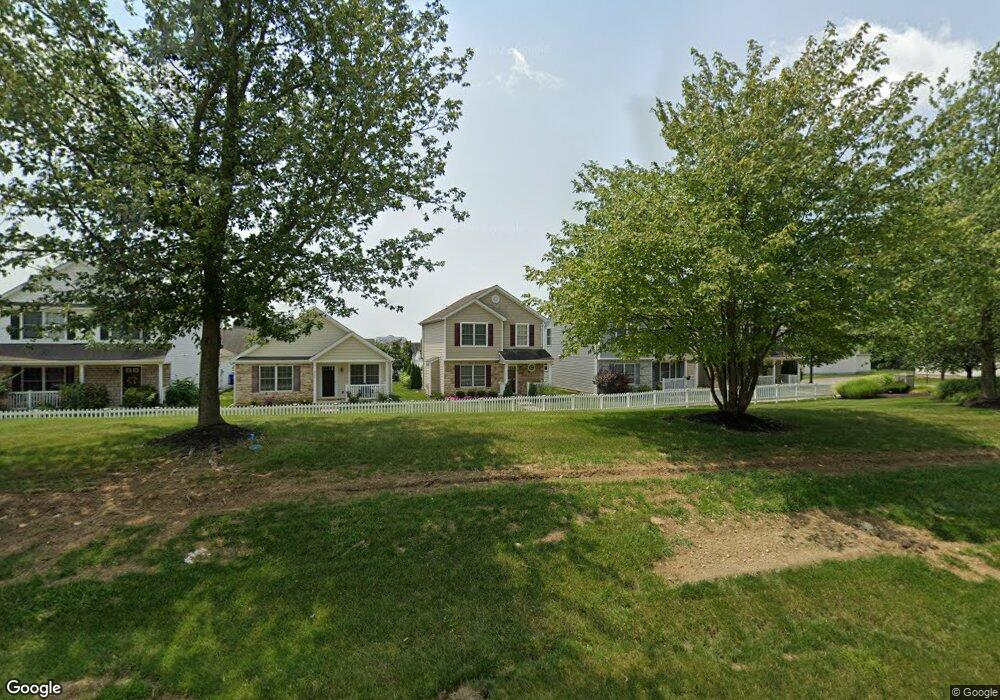
2994 E Powell Rd Unit 53 Columbus, OH 43240
Polaris North NeighborhoodEstimated Value: $310,190 - $344,000
3
Beds
2
Baths
1,213
Sq Ft
$269/Sq Ft
Est. Value
About This Home
This home is located at 2994 E Powell Rd Unit 53, Columbus, OH 43240 and is currently estimated at $326,298, approximately $269 per square foot. 2994 E Powell Rd Unit 53 is a home located in Delaware County with nearby schools including Freedom Trail Elementary School, Olentangy Orange Middle School, and Orange High School.
Ownership History
Date
Name
Owned For
Owner Type
Purchase Details
Closed on
May 8, 2020
Sold by
Awuor Victor
Bought by
De La Tierra Holdings Llc
Current Estimated Value
Purchase Details
Closed on
Apr 27, 2017
Sold by
Gualardo Zachary
Bought by
Awuor Victor
Home Financials for this Owner
Home Financials are based on the most recent Mortgage that was taken out on this home.
Original Mortgage
$141,600
Interest Rate
4.3%
Mortgage Type
New Conventional
Purchase Details
Closed on
Aug 3, 2006
Sold by
Dominion Homes Inc
Bought by
Ramey Jodi L
Home Financials for this Owner
Home Financials are based on the most recent Mortgage that was taken out on this home.
Original Mortgage
$146,070
Interest Rate
6.88%
Mortgage Type
FHA
Create a Home Valuation Report for This Property
The Home Valuation Report is an in-depth analysis detailing your home's value as well as a comparison with similar homes in the area
Home Values in the Area
Average Home Value in this Area
Purchase History
| Date | Buyer | Sale Price | Title Company |
|---|---|---|---|
| De La Tierra Holdings Llc | -- | None Available | |
| Awuor Victor | $177,000 | None Available | |
| Ramey Jodi L | $147,300 | Alliance Title |
Source: Public Records
Mortgage History
| Date | Status | Borrower | Loan Amount |
|---|---|---|---|
| Previous Owner | Awuor Victor | $141,600 | |
| Previous Owner | Ramey Jodi L | $146,070 |
Source: Public Records
Tax History
| Year | Tax Paid | Tax Assessment Tax Assessment Total Assessment is a certain percentage of the fair market value that is determined by local assessors to be the total taxable value of land and additions on the property. | Land | Improvement |
|---|---|---|---|---|
| 2024 | $4,380 | $78,690 | $16,980 | $61,710 |
| 2023 | $4,396 | $78,690 | $16,980 | $61,710 |
| 2022 | $4,067 | $59,260 | $14,110 | $45,150 |
| 2021 | $4,091 | $59,260 | $14,110 | $45,150 |
| 2020 | $4,023 | $59,260 | $14,110 | $45,150 |
| 2019 | $3,160 | $48,370 | $12,250 | $36,120 |
| 2018 | $3,175 | $48,370 | $12,250 | $36,120 |
| 2017 | $3,141 | $45,360 | $12,250 | $33,110 |
| 2016 | $3,170 | $45,360 | $12,250 | $33,110 |
| 2015 | $2,896 | $45,360 | $12,250 | $33,110 |
| 2014 | $2,937 | $45,360 | $12,250 | $33,110 |
| 2013 | $3,005 | $45,360 | $12,250 | $33,110 |
Source: Public Records
Map
Nearby Homes
- 9339 Prestwick Green Dr
- 9190 Prestwick Green Dr
- 2935 Laura Place
- 9136 Scenic View Cir
- 3240 Autumn Applause Dr
- 2849 Pleasantdale Dr
- 1274 Allington Ln Unit 1274
- 3565 Birkland Cir
- 3595 Evelynton Ave
- 9194 Gramford St Unit 9194
- 3637 Birkland Cir
- 2372 Minnie Ct
- 3773 Kelsey Ct
- 3732 Evelynton Ave
- 3749 Birkland Cir
- 7770 Bale Kenyon Rd
- 2298 Maxwell Ave
- 1746 E Powell Rd
- 2358 Bold Venture Dr
- 2107 Hayer Ct
- 2994 E Powell Rd
- 2990 E Powell Rd
- 2990 E Powell Rd Unit 52
- 2998 E Powell Rd
- 2986 E Powell Rd Unit 51
- 3002 E Powell Rd
- 3002 E Powell Rd Unit 55
- 9329 Cliff Springs Trail
- 9329 Cliff Springs Trail Unit 57
- 3006 E Powell Rd
- 3006 E Powell Rd Unit 56
- 9328 Polaris Green Dr
- 9328 Polaris Green Dr Unit 50
- 9325 Cliff Springs Trail
- 9324 Polaris Green Dr
- 9324 Polaris Green Dr Unit 49
- 2978 E Powell Rd
- 9321 Cliff Springs Trail
- 9320 Polaris Green Dr
- 9331 Polaris Green Dr
Your Personal Tour Guide
Ask me questions while you tour the home.