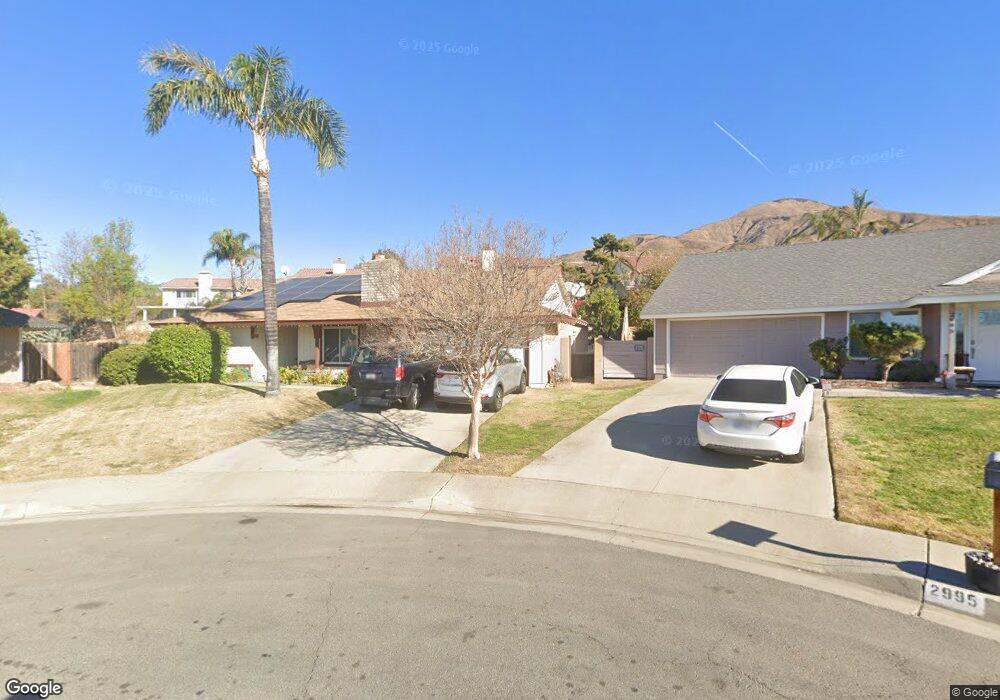
2994 Oleta Ct Highland, CA 92346
Amber Hills NeighborhoodEstimated Value: $349,000 - $550,000
4
Beds
2
Baths
1,497
Sq Ft
$306/Sq Ft
Est. Value
About This Home
This home is located at 2994 Oleta Ct, Highland, CA 92346 and is currently estimated at $458,243, approximately $306 per square foot. 2994 Oleta Ct is a home located in San Bernardino County with nearby schools including Belvedere Elementary, Serrano Middle School, and San Gorgonio High School.
Ownership History
Date
Name
Owned For
Owner Type
Purchase Details
Closed on
Oct 12, 2021
Sold by
Mielak Robert and Mielak Michelle
Bought by
Mielak Diane M and David D Diane M Mielak Trust
Current Estimated Value
Purchase Details
Closed on
Aug 13, 2003
Sold by
Mielak David and Mielak Diane
Bought by
Mielak Robert and Mielak Michelle
Home Financials for this Owner
Home Financials are based on the most recent Mortgage that was taken out on this home.
Original Mortgage
$120,700
Interest Rate
6.3%
Mortgage Type
Purchase Money Mortgage
Purchase Details
Closed on
Dec 14, 2001
Sold by
Bower Wayne and Bower Mary C
Bought by
Mielak Robert and Mielak Michelle
Home Financials for this Owner
Home Financials are based on the most recent Mortgage that was taken out on this home.
Original Mortgage
$117,000
Interest Rate
6.51%
Create a Home Valuation Report for This Property
The Home Valuation Report is an in-depth analysis detailing your home's value as well as a comparison with similar homes in the area
Home Values in the Area
Average Home Value in this Area
Purchase History
| Date | Buyer | Sale Price | Title Company |
|---|---|---|---|
| Mielak Diane M | $300,000 | First American Title Company | |
| Mielak Robert | -- | American Title | |
| Mielak Robert | $130,000 | American Title Co |
Source: Public Records
Mortgage History
| Date | Status | Borrower | Loan Amount |
|---|---|---|---|
| Previous Owner | Mielak Robert | $120,700 | |
| Previous Owner | Mielak Robert | $117,000 |
Source: Public Records
Tax History
| Year | Tax Paid | Tax Assessment Tax Assessment Total Assessment is a certain percentage of the fair market value that is determined by local assessors to be the total taxable value of land and additions on the property. | Land | Improvement |
|---|---|---|---|---|
| 2025 | $2,485 | $192,049 | $48,012 | $144,037 |
| 2024 | $2,432 | $188,284 | $47,071 | $141,213 |
| 2023 | $2,369 | $184,592 | $46,148 | $138,444 |
| 2022 | $2,458 | $445,000 | $135,000 | $310,000 |
| 2021 | $4,058 | $177,428 | $44,358 | $133,070 |
| 2020 | $4,061 | $175,609 | $43,903 | $131,706 |
| 2019 | $3,991 | $172,166 | $43,042 | $129,124 |
| 2018 | $3,964 | $168,790 | $42,198 | $126,592 |
| 2017 | $3,852 | $165,481 | $41,371 | $124,110 |
| 2016 | $2,137 | $162,236 | $40,560 | $121,676 |
| 2015 | $2,024 | $159,799 | $39,951 | $119,848 |
| 2014 | $1,966 | $156,668 | $39,168 | $117,500 |
Source: Public Records
Map
Nearby Homes
- 2904 Oleta Ln
- 2855 Piedmont Dr
- 2637 Mirada St
- 2649 28th St
- 2905 Overland Ct
- 2692 Highland Ave Unit 90
- 2692 Highland Ave Unit 67
- 2692 Highland Ave Unit 106
- 2705 Cole Ave
- 2692 E Highland Ave Unit 8
- 2535 Mercedes Ave
- 6090 Mirada Place
- 3595 Citrus St
- 3553 E Highland Ave
- 6224 Stanton Ave
- 4040 E Piedmont Dr Unit 300
- 3505 Orchid Dr E
- 3383 Highland Ave
- 3513 E Orchid Dr
- 2137 Pepper Dr
- 2994 Oleta Ln N
- 2982 Oleta Ct
- 2995 Oleta Ct
- 3061 Piedmont Dr
- 3049 Piedmont Dr
- 3073 Piedmont Dr Unit 1
- 3073 Piedmont Dr
- 2968 Oleta Ct
- 2977 Oleta Ct
- 3037 Piedmont Dr
- 3083 Piedmont Dr
- 3005 Roadrunner Ct
- 3019 Roadrunner Ct
- 2995 Roadrunner Ct
- 2994 Bangor Ave
- 2950 Oleta Ct
- 2959 Oleta Ct
- 3095 Piedmont Dr
- 2977 Roadrunner Ct
- 3035 Roadrunner Ct
Your Personal Tour Guide
Ask me questions while you tour the home.