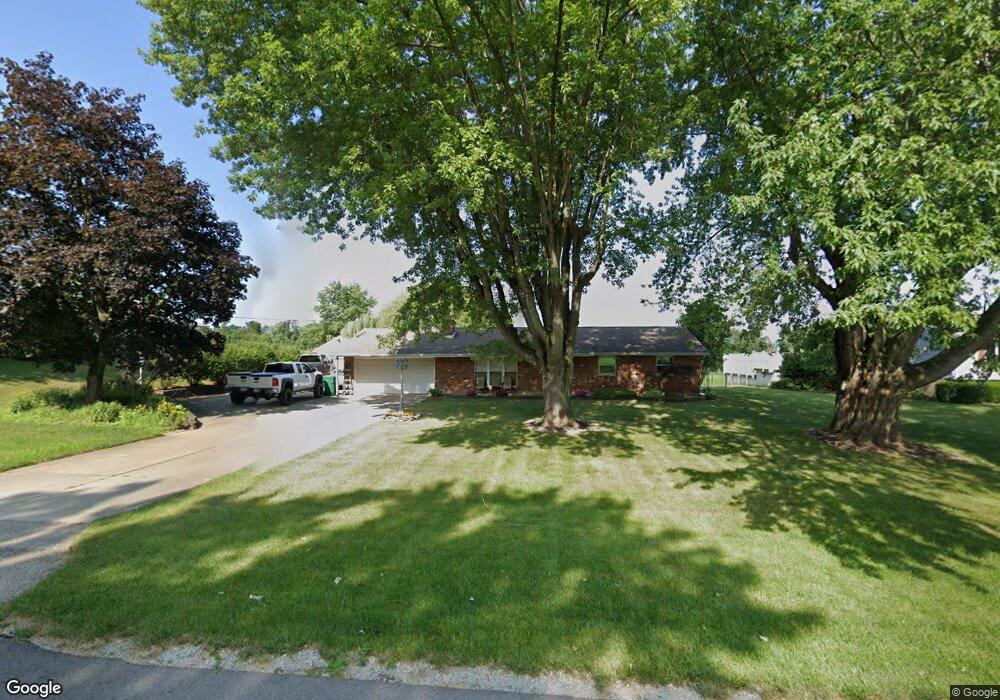
2995 Arthur Rd Springfield, OH 45502
Estimated Value: $250,000 - $346,000
3
Beds
2
Baths
1,131
Sq Ft
$256/Sq Ft
Est. Value
About This Home
This home is located at 2995 Arthur Rd, Springfield, OH 45502 and is currently estimated at $289,604, approximately $256 per square foot. 2995 Arthur Rd is a home located in Clark County with nearby schools including Greenon Elementary School, Greenon Jr. High School, and Greenon High School.
Ownership History
Date
Name
Owned For
Owner Type
Purchase Details
Closed on
Jun 21, 2010
Sold by
Jenks Jason C and Burgoyne Jenks Terri
Bought by
Jenks Brian K
Current Estimated Value
Home Financials for this Owner
Home Financials are based on the most recent Mortgage that was taken out on this home.
Original Mortgage
$138,139
Outstanding Balance
$91,510
Interest Rate
4.97%
Mortgage Type
FHA
Estimated Equity
$198,094
Purchase Details
Closed on
May 31, 2002
Sold by
Giffin Frank I and Giffin Pamela S
Bought by
Jenks Jason C and Burgoyne Jenks Terri
Home Financials for this Owner
Home Financials are based on the most recent Mortgage that was taken out on this home.
Original Mortgage
$75,650
Interest Rate
6.95%
Mortgage Type
Balloon
Purchase Details
Closed on
Feb 26, 1996
Sold by
Smith Morton S
Bought by
Giffin Frank I and Giffin Pamela
Home Financials for this Owner
Home Financials are based on the most recent Mortgage that was taken out on this home.
Original Mortgage
$92,650
Interest Rate
7.16%
Mortgage Type
New Conventional
Create a Home Valuation Report for This Property
The Home Valuation Report is an in-depth analysis detailing your home's value as well as a comparison with similar homes in the area
Purchase History
| Date | Buyer | Sale Price | Title Company |
|---|---|---|---|
| Jenks Brian K | $140,000 | Team Title & Closing Service | |
| Jenks Jason C | $115,700 | -- | |
| Giffin Frank I | $105,500 | -- |
Source: Public Records
Mortgage History
| Date | Status | Borrower | Loan Amount |
|---|---|---|---|
| Open | Jenks Brian K | $138,139 | |
| Previous Owner | Jenks Jason C | $75,650 | |
| Previous Owner | Giffin Frank I | $92,650 |
Source: Public Records
Tax History
| Year | Tax Paid | Tax Assessment Tax Assessment Total Assessment is a certain percentage of the fair market value that is determined by local assessors to be the total taxable value of land and additions on the property. | Land | Improvement |
|---|---|---|---|---|
| 2025 | $3,720 | $86,440 | $14,520 | $71,920 |
| 2024 | $3,632 | $69,410 | $13,100 | $56,310 |
| 2023 | $3,632 | $69,410 | $13,100 | $56,310 |
| 2022 | $3,629 | $69,410 | $13,100 | $56,310 |
| 2021 | $3,010 | $51,030 | $9,490 | $41,540 |
| 2020 | $3,018 | $51,030 | $9,490 | $41,540 |
| 2019 | $2,904 | $48,490 | $9,490 | $39,000 |
| 2018 | $2,721 | $44,430 | $8,700 | $35,730 |
| 2017 | $2,728 | $44,433 | $8,701 | $35,732 |
| 2016 | $2,377 | $44,433 | $8,701 | $35,732 |
| 2015 | $2,209 | $39,809 | $7,910 | $31,899 |
| 2014 | $2,214 | $39,809 | $7,910 | $31,899 |
| 2013 | $1,947 | $39,809 | $7,910 | $31,899 |
Source: Public Records
Map
Nearby Homes
- 1290 Red Oaks Cir
- 3319 Wendover St
- 124 Old Mill Rd
- 0 Upper Valley Pike
- 190 Oakridge Dr
- 1109 Montgomery Ave
- 2301 Duquesne Dr
- 1915 W Washington St
- 110 Walter St
- 106 Walter St
- 0 Montgomery Ave
- 1618 W Pleasant St
- 3190 Rebert Pike
- 1828 W Washington St
- 1906-1908 W High St
- 3891 New Carlisle Pike
- 2140 Shawnee Ave
- 00 Russell Ave
- 1920 Russell Ave
- 202 Seever St
Your Personal Tour Guide
Ask me questions while you tour the home.