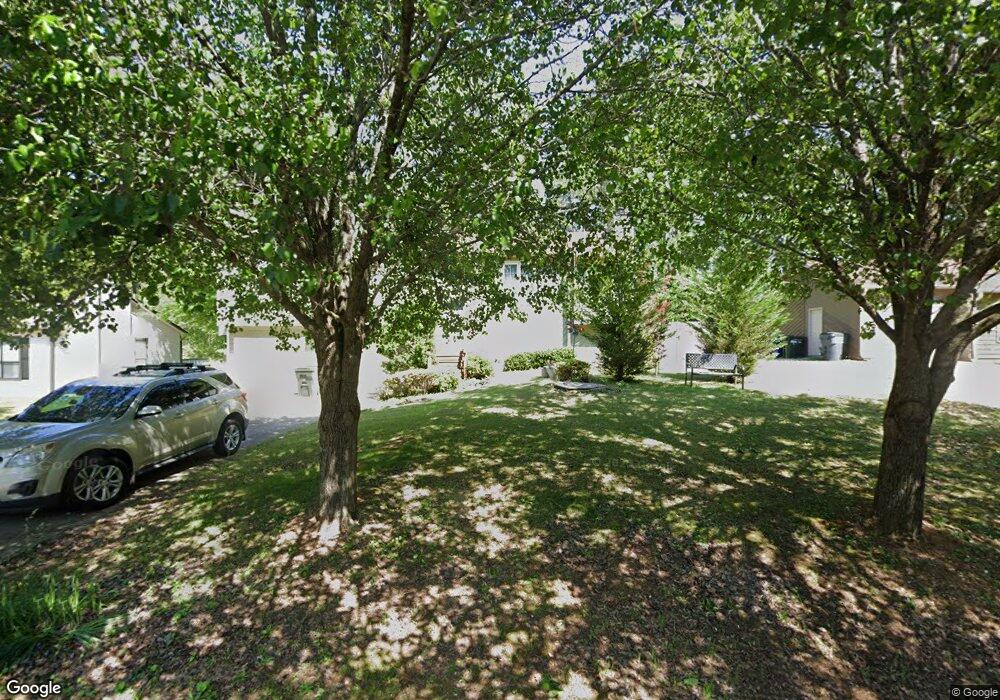
2995 Withers Way SW Marietta, GA 30064
Estimated Value: $308,000 - $342,000
3
Beds
3
Baths
1,322
Sq Ft
$248/Sq Ft
Est. Value
About This Home
This home is located at 2995 Withers Way SW, Marietta, GA 30064 and is currently estimated at $327,319, approximately $247 per square foot. 2995 Withers Way SW is a home located in Cobb County with nearby schools including Hollydale Elementary School, Smitha Middle School, and Osborne High School.
Ownership History
Date
Name
Owned For
Owner Type
Purchase Details
Closed on
Sep 25, 2008
Sold by
Liquidation Props Inc
Bought by
Rios Richard R
Current Estimated Value
Home Financials for this Owner
Home Financials are based on the most recent Mortgage that was taken out on this home.
Original Mortgage
$117,790
Outstanding Balance
$78,084
Interest Rate
6.45%
Mortgage Type
FHA
Estimated Equity
$249,235
Purchase Details
Closed on
Feb 5, 2008
Sold by
David Joseph C and David Brenda A
Bought by
Liquidation Props Inc
Home Financials for this Owner
Home Financials are based on the most recent Mortgage that was taken out on this home.
Original Mortgage
$196,875
Interest Rate
5.62%
Mortgage Type
Trade
Purchase Details
Closed on
Apr 27, 2000
Sold by
Dobbs Donald W and Dobbs Lemora B
Bought by
David Joseph C
Home Financials for this Owner
Home Financials are based on the most recent Mortgage that was taken out on this home.
Original Mortgage
$109,844
Interest Rate
8.14%
Mortgage Type
FHA
Create a Home Valuation Report for This Property
The Home Valuation Report is an in-depth analysis detailing your home's value as well as a comparison with similar homes in the area
Home Values in the Area
Average Home Value in this Area
Purchase History
| Date | Buyer | Sale Price | Title Company |
|---|---|---|---|
| Rios Richard R | $118,000 | -- | |
| Liquidation Props Inc | $90,000 | -- | |
| David Joseph C | $109,900 | -- |
Source: Public Records
Mortgage History
| Date | Status | Borrower | Loan Amount |
|---|---|---|---|
| Open | Rios Richard R | $117,790 | |
| Previous Owner | Liquidation Props Inc | $196,875 | |
| Previous Owner | David Joseph C | $109,844 |
Source: Public Records
Tax History Compared to Growth
Tax History
| Year | Tax Paid | Tax Assessment Tax Assessment Total Assessment is a certain percentage of the fair market value that is determined by local assessors to be the total taxable value of land and additions on the property. | Land | Improvement |
|---|---|---|---|---|
| 2025 | $2,662 | $115,880 | $24,000 | $91,880 |
| 2024 | $2,664 | $115,880 | $24,000 | $91,880 |
| 2023 | $2,140 | $116,756 | $16,000 | $100,756 |
| 2022 | $1,766 | $73,896 | $12,000 | $61,896 |
| 2021 | $1,766 | $73,896 | $12,000 | $61,896 |
| 2020 | $1,536 | $63,380 | $12,000 | $51,380 |
| 2019 | $1,423 | $58,208 | $8,800 | $49,408 |
| 2018 | $1,311 | $53,108 | $10,000 | $43,108 |
| 2017 | $934 | $41,416 | $10,000 | $31,416 |
| 2016 | $663 | $31,940 | $8,000 | $23,940 |
| 2015 | $681 | $31,940 | $8,000 | $23,940 |
| 2014 | $687 | $31,940 | $0 | $0 |
Source: Public Records
Map
Nearby Homes
- 2448 Wood Meadows Dr SW
- 2730 Hembree Rd SW
- 2723 Horseshoe Creek Dr SW
- 2614 Smith Ave SW
- 3106 Yellowhammer Dr Unit 28
- 3118 Yellowhammer Dr Unit 25
- 2705 Owens Ave SW
- 2752 Owens Ave SW Unit 5
- 3089 Yellowhammer Dr
- 3614 Josh Ct
- Stratford Plan at Barrett Cove
- Sudbury Plan at Barrett Cove
- Salisbury Plan at Barrett Cove
- 2554 Red Barn Rd SW
- 2450 Horseshoe Bend Rd SW
- 2599 Candler Way SW
- 3088 Yellowhammer Dr Unit 32
- 3088 Yellowhammer Dr
- 2318 Powder Springs Rd SW
- 2608 Foxwood Place SW Unit IV
- 2993 Withers Way SW
- 2997 Withers Way SW
- 0 Withers Way SW Unit 3187544
- 0 Withers Way SW Unit 8910346
- 0 Withers Way SW Unit 7250350
- 0 Withers Way SW Unit 7527983
- 2831 Horseshoe Bend Rd SW
- 2999 Withers Way SW
- 2991 Withers Way SW
- 3000 Withers Way SW
- 3021 Fetlock Dr SW
- 2989 Withers Way SW
- 3018 Fetlock Dr SW
- 2996 Withers Way SW
- 2841 Horseshoe Bend Rd SW
- 2994 Withers Way SW
- 3019 Fetlock Dr SW
- 2338 Horseshoe Bend Rd SW
- 0 Old Horseshoe Bend Rd SW
- 2987 Withers Way SW