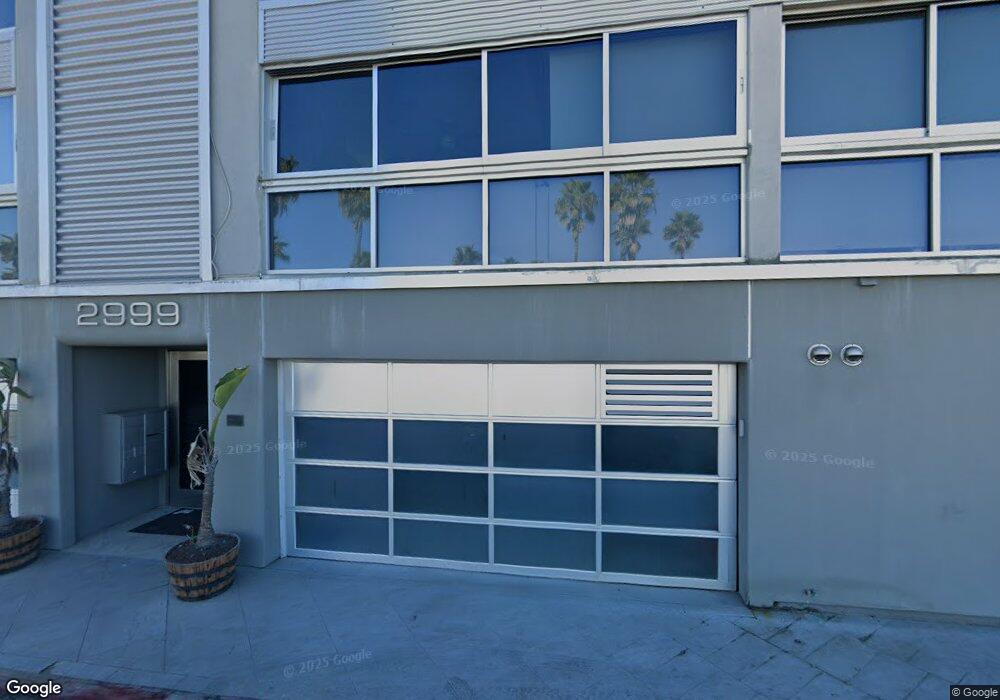
2999 Ocean Front Walk Unit 3 San Diego, CA 92109
Mission Beach NeighborhoodEstimated Value: $1,520,727 - $2,396,000
2
Beds
2
Baths
1,054
Sq Ft
$1,816/Sq Ft
Est. Value
About This Home
This home is located at 2999 Ocean Front Walk Unit 3, San Diego, CA 92109 and is currently estimated at $1,913,909, approximately $1,815 per square foot. 2999 Ocean Front Walk Unit 3 is a home located in San Diego County with nearby schools including Pacific Beach Elementary School, Pacific Beach Middle, and Mission Bay High School.
Ownership History
Date
Name
Owned For
Owner Type
Purchase Details
Closed on
Mar 19, 2010
Sold by
Deutsche Bank National Trust Company
Bought by
Doug Robertson Holdings Ltd
Current Estimated Value
Purchase Details
Closed on
Sep 14, 2009
Sold by
Vegdahl Kent
Bought by
Deutsche Bank National Trust Company
Purchase Details
Closed on
Oct 3, 2006
Sold by
Ocean Pacific Xii Llc
Bought by
Vegdahl Kent
Home Financials for this Owner
Home Financials are based on the most recent Mortgage that was taken out on this home.
Original Mortgage
$1,500,000
Interest Rate
6.87%
Mortgage Type
New Conventional
Create a Home Valuation Report for This Property
The Home Valuation Report is an in-depth analysis detailing your home's value as well as a comparison with similar homes in the area
Home Values in the Area
Average Home Value in this Area
Purchase History
| Date | Buyer | Sale Price | Title Company |
|---|---|---|---|
| Doug Robertson Holdings Ltd | $880,000 | Lsi Title Agency | |
| Deutsche Bank National Trust Company | $1,530,000 | None Available | |
| Vegdahl Kent | $1,975,000 | Chicago Title Co |
Source: Public Records
Mortgage History
| Date | Status | Borrower | Loan Amount |
|---|---|---|---|
| Previous Owner | Vegdahl Kent | $1,500,000 |
Source: Public Records
Tax History Compared to Growth
Tax History
| Year | Tax Paid | Tax Assessment Tax Assessment Total Assessment is a certain percentage of the fair market value that is determined by local assessors to be the total taxable value of land and additions on the property. | Land | Improvement |
|---|---|---|---|---|
| 2025 | $13,720 | $1,135,899 | $845,474 | $290,425 |
| 2024 | $13,720 | $1,113,628 | $828,897 | $284,731 |
| 2023 | $13,417 | $1,091,794 | $812,645 | $279,149 |
| 2022 | $13,060 | $1,070,387 | $796,711 | $273,676 |
| 2021 | $12,970 | $1,049,400 | $781,090 | $268,310 |
| 2020 | $12,812 | $1,038,640 | $773,081 | $265,559 |
| 2019 | $12,583 | $1,018,275 | $757,923 | $260,352 |
| 2018 | $11,764 | $998,310 | $743,062 | $255,248 |
| 2017 | $11,491 | $978,737 | $728,493 | $250,244 |
| 2016 | $11,310 | $959,547 | $714,209 | $245,338 |
| 2015 | $11,143 | $945,134 | $703,481 | $241,653 |
| 2014 | $10,964 | $926,621 | $689,701 | $236,920 |
Source: Public Records
Map
Nearby Homes
- 2999 Mission Blvd Unit 201
- 808 Ensenada Ct
- 2965 Mission Blvd Unit 4C
- 2820 Bayside Walk Unit 2
- 2808 Bayside Walk Unit B
- 717 Island Ct
- 2740 Ocean Front Walk
- 2735 Mission Blvd
- 2727 Ocean Front Walk Unit 3
- 722 San Luis Rey Place Unit 24
- 728 Jamaica Ct
- 817 San Luis Rey Place
- 3286-88 Bayside Walk
- 3291 Bayside Walk
- 810 Santa Barbara Place
- 801 Allerton Ct
- 735 Jersey Ct
- 2623 Ocean Front Walk
- 2617 Ocean Front Walk
- 2632 Bayside Walk
- 2999 Ocean Front Walk Unit 3
- 2999 Ocean Front Walk Unit 5
- 2999 Ocean Front Walk Unit 4
- 2999 Ocean Front Walk Unit 2
- 2999 Ocean Front Walk Unit 1
- 2985 Ocean Front Walk Unit 2
- 2985 Ocean Front Walk Unit B
- 2985 Ocean Front Walk Unit A
- 2985 Ocean Front Walk Unit 1
- 2985 Ocean Front Walk
- 2981 Strandway
- 2981 Ocean Front Walk
- 711 San Fernando Place
- 711 #1-4 San Fernando Place
- 2975 Ocean Front Walk Unit 1
- 2975 Ocean Front Walk Unit 3
- 2975 Ocean Front Walk
- 715 San Fernando Place Unit 19
- 714 Ensenada Ct Unit 16
- 721-23 San Fernando Place