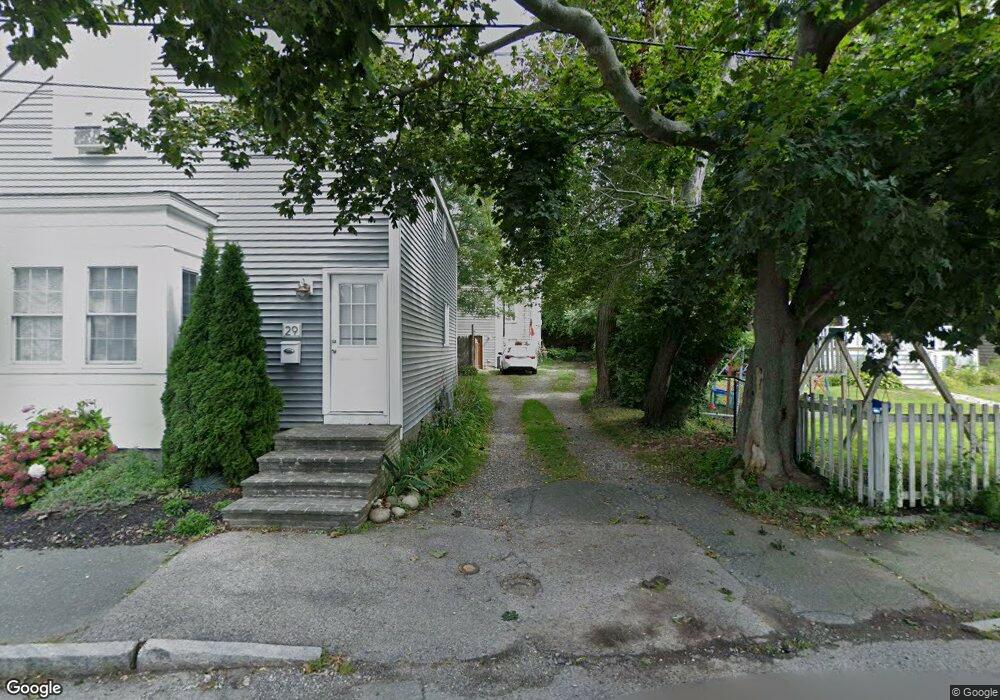
29R Sargent St Gloucester, MA 01930
Central Gloucester NeighborhoodEstimated Value: $431,000 - $523,000
3
Beds
2
Baths
868
Sq Ft
$556/Sq Ft
Est. Value
About This Home
This home is located at 29R Sargent St, Gloucester, MA 01930 and is currently estimated at $482,520, approximately $555 per square foot. 29R Sargent St is a home located in Essex County with nearby schools including East Veterans Memorial Elementary, Ralph B O'maley Middle School, and Gloucester High School.
Ownership History
Date
Name
Owned For
Owner Type
Purchase Details
Closed on
Sep 28, 2001
Sold by
Heussi Jeremy
Bought by
Barry K Michael and Barry Jaime L
Current Estimated Value
Home Financials for this Owner
Home Financials are based on the most recent Mortgage that was taken out on this home.
Original Mortgage
$117,750
Outstanding Balance
$46,159
Interest Rate
6.91%
Mortgage Type
Purchase Money Mortgage
Estimated Equity
$436,361
Purchase Details
Closed on
Jan 18, 2000
Sold by
Hirsch Jeffrey
Bought by
Hirsch Jeffrey
Create a Home Valuation Report for This Property
The Home Valuation Report is an in-depth analysis detailing your home's value as well as a comparison with similar homes in the area
Home Values in the Area
Average Home Value in this Area
Purchase History
| Date | Buyer | Sale Price | Title Company |
|---|---|---|---|
| Barry K Michael | $157,000 | -- | |
| Hirsch Jeffrey | $50,000 | -- |
Source: Public Records
Mortgage History
| Date | Status | Borrower | Loan Amount |
|---|---|---|---|
| Open | Hirsch Jeffrey | $117,750 | |
| Closed | Hirsch Jeffrey | $31,400 | |
| Previous Owner | Hirsch Jeffrey | $86,000 |
Source: Public Records
Tax History Compared to Growth
Tax History
| Year | Tax Paid | Tax Assessment Tax Assessment Total Assessment is a certain percentage of the fair market value that is determined by local assessors to be the total taxable value of land and additions on the property. | Land | Improvement |
|---|---|---|---|---|
| 2025 | $4,055 | $417,200 | $118,200 | $299,000 |
| 2024 | $4,005 | $411,600 | $112,600 | $299,000 |
| 2023 | $3,833 | $361,900 | $100,500 | $261,400 |
| 2022 | $3,714 | $316,600 | $87,400 | $229,200 |
| 2021 | $3,586 | $288,300 | $79,500 | $208,800 |
| 2020 | $3,472 | $281,600 | $79,500 | $202,100 |
| 2019 | $3,251 | $256,200 | $79,500 | $176,700 |
| 2018 | $3,063 | $236,900 | $79,500 | $157,400 |
| 2017 | $2,862 | $217,000 | $71,600 | $145,400 |
| 2016 | $2,691 | $197,700 | $71,500 | $126,200 |
| 2015 | -- | $188,000 | $71,500 | $116,500 |
Source: Public Records
Map
Nearby Homes
- 40 Sargent St
- 119 Pleasant St
- 33 Maplewood Ave Unit 21
- 16 Cleveland Place Unit 11
- 78 Grove St
- 4 Mount Vernon St
- 22 Taylor St Unit 1
- 19 Mystic Ave
- 90 Middle St Unit L
- 160 Prospect St Unit 3
- 191 Main St Unit 2B
- 191 Main St Unit 3
- 191 Main St Unit 2A
- 65 Poplar St
- 8 Summer St Unit 103
- 35 Middle St Unit 4
- 196 Washington St
- 5 Washington Square
- 33 Middle St
- 15 Harvard St
- 29 Sargent St
- 31 1/2 Sargent St
- 25 Sargent St
- 33R Sargent St
- 4-6 Sargent St
- 23 Sargent St
- 26 Millett St
- 37R Sargent St
- 22 Millett St
- 28 Millett St
- 28 Millett St Unit 2
- 36 Sargent St
- 34 Millett St
- 20 Millett St
- 20 Millett St Unit 1
- 18 Millett St
- 30 Millett St
- 16 Millett St
- 32 Millett St
- 32R Millett St