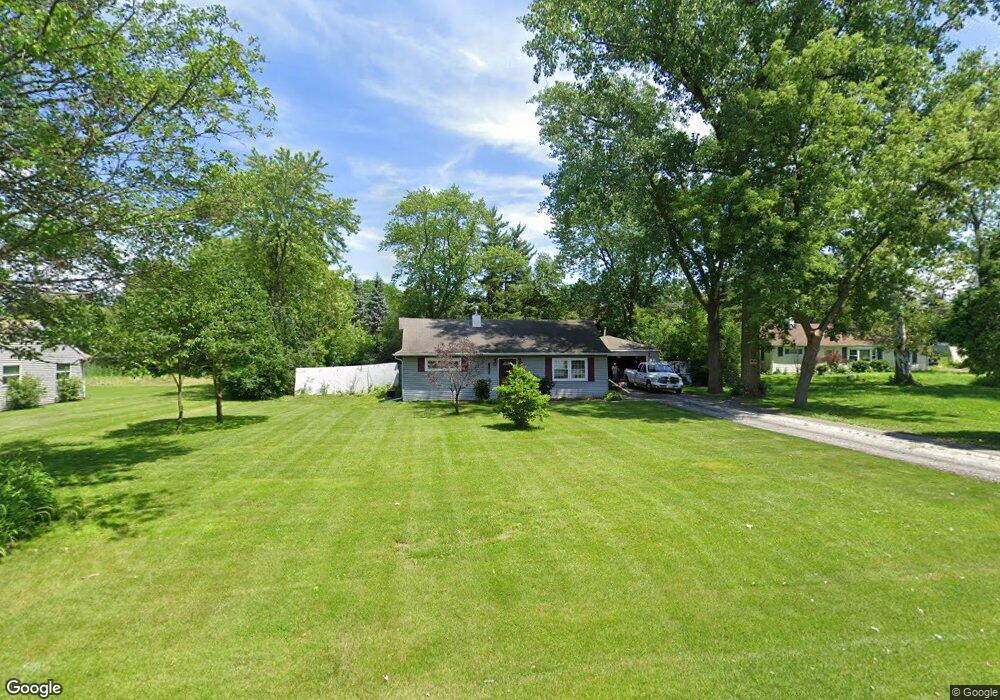
2N185 Pleasant Hill Rd Carol Stream, IL 60188
South Carol Stream NeighborhoodEstimated Value: $258,506 - $279,000
3
Beds
1
Bath
864
Sq Ft
$313/Sq Ft
Est. Value
About This Home
This home is located at 2N185 Pleasant Hill Rd, Carol Stream, IL 60188 and is currently estimated at $270,377, approximately $312 per square foot. 2N185 Pleasant Hill Rd is a home located in DuPage County with nearby schools including Field Kindergarten Center, Carol Stream Elementary School, and Jay Stream Middle School.
Ownership History
Date
Name
Owned For
Owner Type
Purchase Details
Closed on
Jun 21, 2018
Sold by
Zimmerle Scott and Zimmerle Asha
Bought by
Lewan Nicholas
Current Estimated Value
Home Financials for this Owner
Home Financials are based on the most recent Mortgage that was taken out on this home.
Original Mortgage
$158,650
Outstanding Balance
$137,968
Interest Rate
4.75%
Mortgage Type
New Conventional
Estimated Equity
$132,409
Purchase Details
Closed on
Jun 30, 2005
Sold by
Thompson Carrie A
Bought by
Zimmerle Scott and Zimmerle Asha
Home Financials for this Owner
Home Financials are based on the most recent Mortgage that was taken out on this home.
Original Mortgage
$149,600
Interest Rate
5.86%
Mortgage Type
Fannie Mae Freddie Mac
Purchase Details
Closed on
Jan 30, 2002
Sold by
Cioffoletti Jess D
Bought by
Thompson Carrie A
Home Financials for this Owner
Home Financials are based on the most recent Mortgage that was taken out on this home.
Original Mortgage
$133,950
Interest Rate
7.24%
Create a Home Valuation Report for This Property
The Home Valuation Report is an in-depth analysis detailing your home's value as well as a comparison with similar homes in the area
Home Values in the Area
Average Home Value in this Area
Purchase History
| Date | Buyer | Sale Price | Title Company |
|---|---|---|---|
| Lewan Nicholas | $167,000 | Chicago Title Insurance Comp | |
| Zimmerle Scott | $189,000 | Ctic | |
| Thompson Carrie A | $141,000 | -- |
Source: Public Records
Mortgage History
| Date | Status | Borrower | Loan Amount |
|---|---|---|---|
| Open | Lewan Nicholas | $158,650 | |
| Previous Owner | Zimmerle Scott | $149,600 | |
| Previous Owner | Thompson Carrie A | $133,950 |
Source: Public Records
Tax History Compared to Growth
Tax History
| Year | Tax Paid | Tax Assessment Tax Assessment Total Assessment is a certain percentage of the fair market value that is determined by local assessors to be the total taxable value of land and additions on the property. | Land | Improvement |
|---|---|---|---|---|
| 2024 | $5,420 | $74,248 | $32,433 | $41,815 |
| 2023 | $5,088 | $67,900 | $29,660 | $38,240 |
| 2022 | $5,030 | $63,500 | $29,470 | $34,030 |
| 2021 | $4,778 | $60,330 | $28,000 | $32,330 |
| 2020 | $4,691 | $58,860 | $27,320 | $31,540 |
| 2019 | $4,500 | $56,560 | $26,250 | $30,310 |
| 2018 | $3,983 | $50,030 | $23,220 | $26,810 |
| 2017 | $3,751 | $46,370 | $21,520 | $24,850 |
| 2016 | $3,530 | $42,920 | $19,920 | $23,000 |
| 2015 | $3,428 | $40,050 | $18,590 | $21,460 |
| 2014 | $3,976 | $44,820 | $18,590 | $26,230 |
| 2013 | $4,004 | $46,360 | $19,230 | $27,130 |
Source: Public Records
Map
Nearby Homes
- 27W130 W Street Charles Rd
- Lot 2 W Street Charles Rd
- 426 Thunderbird Trail
- 352 Sioux Ln
- 26W199 Klein Creek Dr
- 299 Bennett Dr
- 403 Arrowhead Trail
- 342 Seminole Ln
- 552 Cochise Place
- 269 Thunderbird Trail
- 229 Shawnee Dr
- 27W046 North Ave
- 206 Yuma Ln
- 1N539 Turnberry Ln
- 332 El Paso Ln
- 1430 Preserve Dr Unit 29
- 1N060 LOT 1 Morse St
- 1N060 LOT 2 Morse St
- 1N060 LOT 4 Morse St
- 1043 Quarry Ct Unit 11
- 2N211 Pleasant Hill Rd
- 2N273 Pleasant Hill Rd
- 2N261 Pleasant Hill Rd
- 2N225 Pleasant Hill Rd
- 26W246 Burdette Ave
- 26W243 Burdette Ave
- 2N141 Pleasant Hill Rd
- 26W215 North Ave
- 26W258 Burdette Ave
- 26W258 Burdette Ave
- 26W261 Burdette Ave
- 26W245 North Ave
- 2N131 Pleasant Hill Rd
- 26W271 Burdette Ave
- 26W270 Burdette Ave
- 0 Pleasant Hill Rd
- 26W257 North Ave
- 26W246 Peterson Ave
- 26W258 Peterson Ave
- 2N117 Pleasant Hill Rd