3 1/2 S Main St Orange, MA 01364
--
Bed
--
Bath
3,417
Sq Ft
--
Built
About This Home
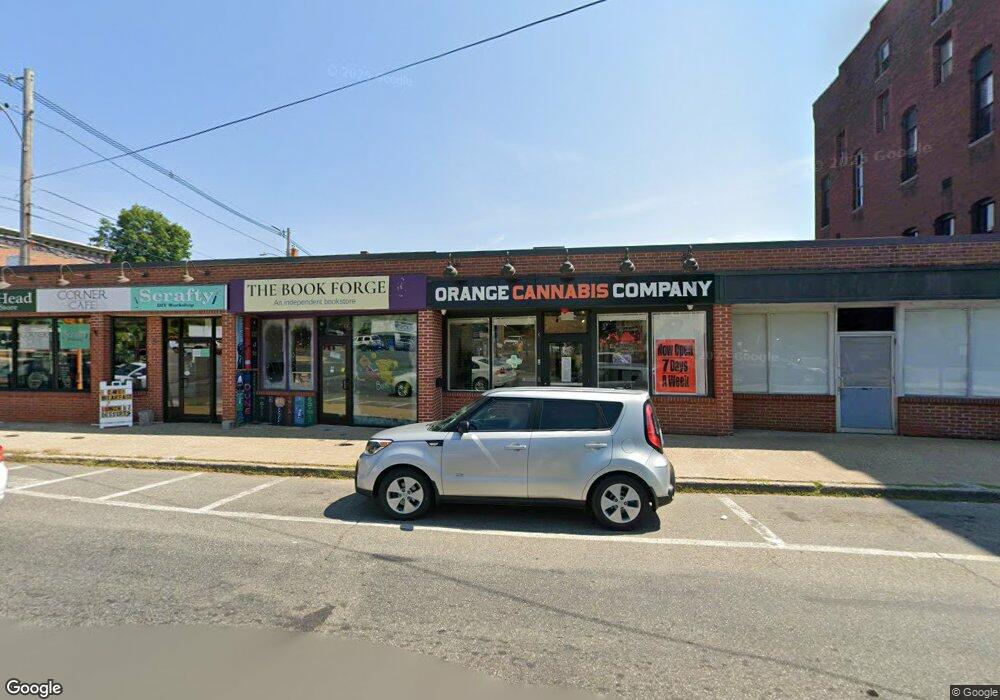
This home is located at 3 1/2 S Main St, Orange, MA 01364. 3 1/2 S Main St is a home located in Franklin County with nearby schools including Fisher Hill and Ralph C Mahar Regional School.
Ownership History
Date
Name
Owned For
Owner Type
Purchase Details
Closed on
Aug 9, 2007
Sold by
D South Rt
Bought by
Anderson Paul F and Anderson Brenda L
Home Financials for this Owner
Home Financials are based on the most recent Mortgage that was taken out on this home.
Original Mortgage
$84,500
Interest Rate
6.72%
Mortgage Type
Commercial
Purchase Details
Closed on
Apr 18, 2003
Sold by
Orange Cir Rt
Bought by
D South Rt
Home Financials for this Owner
Home Financials are based on the most recent Mortgage that was taken out on this home.
Original Mortgage
$25,000
Interest Rate
5.75%
Mortgage Type
Commercial
Create a Home Valuation Report for This Property
The Home Valuation Report is an in-depth analysis detailing your home's value as well as a comparison with similar homes in the area
Home Values in the Area
Average Home Value in this Area
Purchase History
| Date | Buyer | Sale Price | Title Company |
|---|---|---|---|
| Anderson Paul F | $100,000 | -- | |
| D South Rt | $20,000 | -- |
Source: Public Records
Mortgage History
| Date | Status | Borrower | Loan Amount |
|---|---|---|---|
| Open | D South Rt | $60,000 | |
| Closed | Anderson Paul F | $84,500 | |
| Previous Owner | D South Rt | $25,000 |
Source: Public Records
Tax History Compared to Growth
Tax History
| Year | Tax Paid | Tax Assessment Tax Assessment Total Assessment is a certain percentage of the fair market value that is determined by local assessors to be the total taxable value of land and additions on the property. | Land | Improvement |
|---|---|---|---|---|
| 2025 | $13 | $81,300 | $0 | $81,300 |
| 2024 | $1,418 | $81,300 | $0 | $81,300 |
| 2023 | $1,460 | $81,300 | $0 | $81,300 |
| 2022 | $1,554 | $81,300 | $0 | $81,300 |
| 2021 | $880 | $43,900 | $0 | $43,900 |
| 2020 | $856 | $42,100 | $0 | $42,100 |
| 2019 | $856 | $38,000 | $0 | $38,000 |
| 2018 | $807 | $36,800 | $0 | $36,800 |
| 2017 | $862 | $40,600 | $0 | $40,600 |
| 2016 | $835 | $38,500 | $0 | $38,500 |
| 2015 | $839 | $40,400 | $0 | $40,400 |
| 2014 | $797 | $40,400 | $0 | $40,400 |
Source: Public Records
Map
Nearby Homes