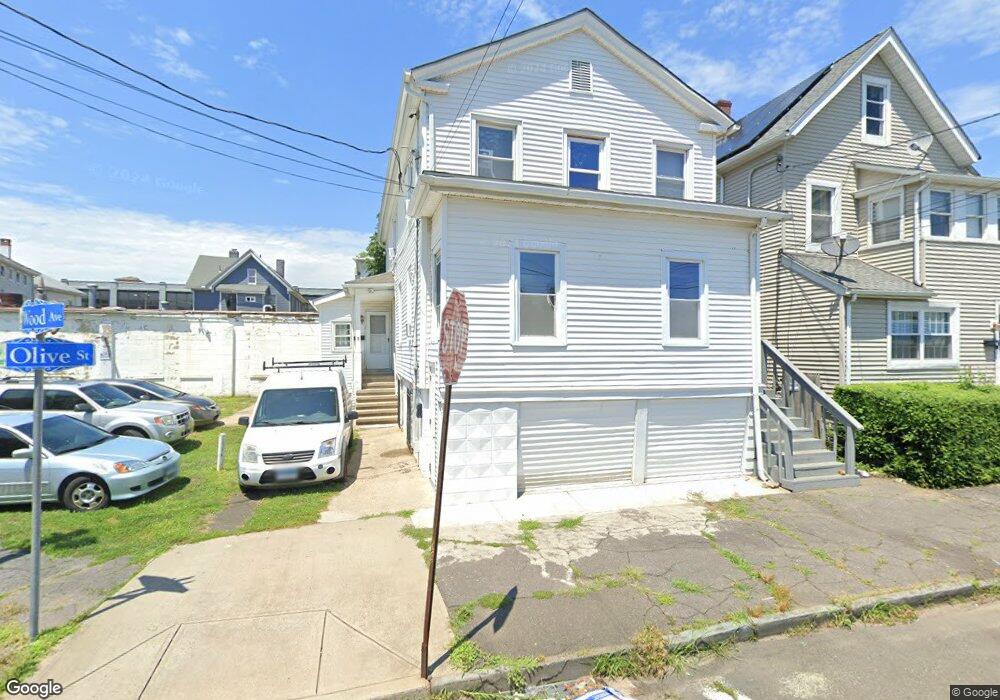
3-5 Olive St Bridge Port, CT 06605
West End-West Side NeighborhoodEstimated Value: $330,171 - $438,000
6
Beds
3
Baths
1,731
Sq Ft
$221/Sq Ft
Est. Value
About This Home
This home is located at 3-5 Olive St, Bridge Port, CT 06605 and is currently estimated at $382,793, approximately $221 per square foot. 3-5 Olive St is a home located in Fairfield County with nearby schools including James J. Curiale School, Bassick High School, and Park City Prep Charter School.
Ownership History
Date
Name
Owned For
Owner Type
Purchase Details
Closed on
Jul 27, 2011
Sold by
Chiriboga Diego
Bought by
Chirigoga Alvaro
Current Estimated Value
Purchase Details
Closed on
Apr 21, 2011
Sold by
Vericrest Opportunity
Bought by
Chiriboga Diego
Purchase Details
Closed on
Oct 18, 2005
Sold by
Fanelli Richard and Fanelli Marcia
Bought by
Francois Sonia
Home Financials for this Owner
Home Financials are based on the most recent Mortgage that was taken out on this home.
Original Mortgage
$223,920
Interest Rate
7.04%
Mortgage Type
Purchase Money Mortgage
Purchase Details
Closed on
Jan 12, 2005
Sold by
Semexant Mario
Bought by
Fanelli Marcia and Fanelli Richard
Purchase Details
Closed on
Oct 10, 1995
Sold by
Coffin Leonard F
Bought by
Bazin Pierre and Semexant Croilot
Purchase Details
Closed on
Aug 23, 1994
Sold by
Peoples Bk
Bought by
Coffina Leonard F
Create a Home Valuation Report for This Property
The Home Valuation Report is an in-depth analysis detailing your home's value as well as a comparison with similar homes in the area
Home Values in the Area
Average Home Value in this Area
Purchase History
| Date | Buyer | Sale Price | Title Company |
|---|---|---|---|
| Chirigoga Alvaro | -- | -- | |
| Chirigoga Alvaro | -- | -- | |
| Chiriboga Diego | $40,000 | -- | |
| Chiriboga Diego | $40,000 | -- | |
| Francois Sonia | $279,900 | -- | |
| Francois Sonia | $279,900 | -- | |
| Fanelli Marcia | $165,000 | -- | |
| Fanelli Marcia | $165,000 | -- | |
| Bazin Pierre | $90,000 | -- | |
| Bazin Pierre | $90,000 | -- | |
| Coffina Leonard F | $5,000 | -- | |
| Coffina Leonard F | $5,000 | -- |
Source: Public Records
Mortgage History
| Date | Status | Borrower | Loan Amount |
|---|---|---|---|
| Previous Owner | Coffina Leonard F | $223,920 |
Source: Public Records
Tax History Compared to Growth
Tax History
| Year | Tax Paid | Tax Assessment Tax Assessment Total Assessment is a certain percentage of the fair market value that is determined by local assessors to be the total taxable value of land and additions on the property. | Land | Improvement |
|---|---|---|---|---|
| 2025 | $5,730 | $131,880 | $38,580 | $93,300 |
| 2024 | $5,730 | $131,880 | $38,580 | $93,300 |
| 2023 | $5,730 | $131,880 | $38,580 | $93,300 |
| 2022 | $5,730 | $131,880 | $38,580 | $93,300 |
| 2021 | $5,730 | $131,880 | $38,580 | $93,300 |
| 2020 | $5,502 | $101,900 | $23,390 | $78,510 |
| 2019 | $5,502 | $101,900 | $23,390 | $78,510 |
| 2018 | $5,540 | $101,900 | $23,390 | $78,510 |
| 2017 | $5,540 | $101,900 | $23,390 | $78,510 |
| 2016 | $5,540 | $101,900 | $23,390 | $78,510 |
| 2015 | $5,879 | $139,320 | $35,370 | $103,950 |
| 2014 | $5,879 | $139,320 | $35,370 | $103,950 |
Source: Public Records
Map
Nearby Homes
- 60 Olive St
- 1373 Iranistan Ave
- 826 Norman St
- 592 Norman St Unit 594
- 414 Wood Ave
- 1199 Iranistan Ave Unit 1201
- 393 Laurel Ave Unit 203
- 393 Laurel Ave Unit 415
- 700 Laurel Ave
- 566 Wood Ave
- 697 Laurel Ave
- 357 Norman St
- 309 Pequonnock St
- 670 Clinton Ave
- 533 Clinton Ave
- 1872 North Ave Unit 1874
- 200 Harral Ave
- 468 Colorado Ave
- 687 Wood Ave
- 865 Iranistan Ave
- 3 Olive St Unit 2
- 3 Olive St Unit Lower
- 3 Olive St
- 238 Wood Ave
- 258 Wood Ave
- 238 Wood Ave Unit 1
- 238 Wood Ave Unit 2
- 9 Olive St Unit 15
- 9 Olive St Unit 2nd Floor
- 255 Wood Ave
- 35 Olive St
- 48 Benham Ave Unit 50
- 38 Benham Ave Unit 40
- 64 Benham Ave Unit 66
- 21 Olive St
- 240 Wood Ave
- 240 Wood Ave Unit Left Side
- 240 Wood Ave Unit 2nd Fl Left Side
- 240 Wood Ave Unit 2nd Fl, Rigth side
- 240 Wood Ave Unit 1 Floor