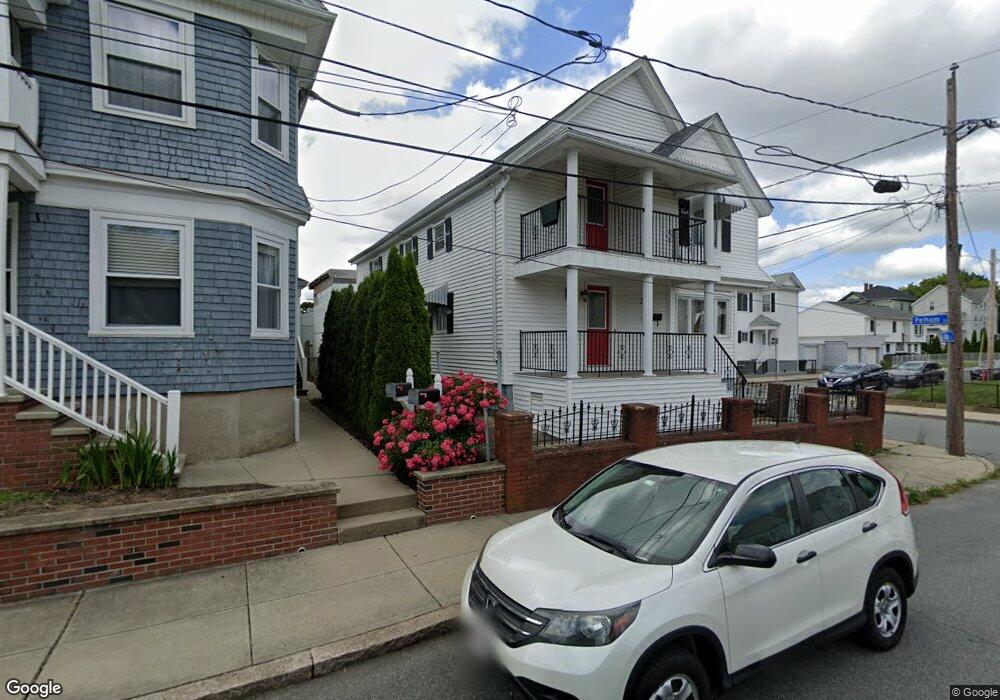
3 Ada St Fall River, MA 02721
Niagara NeighborhoodEstimated Value: $420,019 - $542,000
6
Beds
2
Baths
2,132
Sq Ft
$229/Sq Ft
Est. Value
About This Home
This home is located at 3 Ada St, Fall River, MA 02721 and is currently estimated at $488,505, approximately $229 per square foot. 3 Ada St is a home located in Bristol County with nearby schools including William S Greene, Talbot Innovation School, and B M C Durfee High School.
Ownership History
Date
Name
Owned For
Owner Type
Purchase Details
Closed on
May 3, 2017
Sold by
Araujo Natalie
Bought by
Araujo Maria A
Current Estimated Value
Purchase Details
Closed on
Apr 26, 2017
Sold by
Baldwin Victoria A
Bought by
Araujo Maria A
Purchase Details
Closed on
Mar 30, 2017
Sold by
Araujo Manuel
Bought by
Araujo Maria A
Purchase Details
Closed on
Aug 4, 2016
Sold by
Araujo Maria J Est and Araujo
Bought by
Araujo Fatima C and Araujo Natalie
Purchase Details
Closed on
Feb 7, 1994
Sold by
Rego Milton B and First Natl Bk Boston
Bought by
Araujo Maria Jose
Create a Home Valuation Report for This Property
The Home Valuation Report is an in-depth analysis detailing your home's value as well as a comparison with similar homes in the area
Home Values in the Area
Average Home Value in this Area
Purchase History
| Date | Buyer | Sale Price | Title Company |
|---|---|---|---|
| Araujo Maria A | $75,000 | -- | |
| Araujo Maria A | $80,000 | -- | |
| Araujo Maria A | -- | -- | |
| Araujo Fatima C | -- | -- | |
| Araujo Maria Jose | $14,600 | -- |
Source: Public Records
Mortgage History
| Date | Status | Borrower | Loan Amount |
|---|---|---|---|
| Previous Owner | Araujo Maria Jose | $40,000 | |
| Previous Owner | Araujo Maria Jose | $44,000 |
Source: Public Records
Tax History
| Year | Tax Paid | Tax Assessment Tax Assessment Total Assessment is a certain percentage of the fair market value that is determined by local assessors to be the total taxable value of land and additions on the property. | Land | Improvement |
|---|---|---|---|---|
| 2025 | $4,334 | $378,500 | $105,700 | $272,800 |
| 2024 | $3,985 | $346,800 | $101,800 | $245,000 |
| 2023 | $3,621 | $295,100 | $84,100 | $211,000 |
| 2022 | $3,373 | $267,300 | $80,100 | $187,200 |
| 2021 | $3,145 | $227,400 | $76,200 | $151,200 |
| 2020 | $2,855 | $197,600 | $75,100 | $122,500 |
| 2019 | $2,721 | $186,600 | $72,300 | $114,300 |
| 2018 | $2,637 | $180,400 | $78,300 | $102,100 |
| 2017 | $2,404 | $171,700 | $74,600 | $97,100 |
| 2016 | $2,376 | $174,300 | $79,400 | $94,900 |
| 2015 | $2,286 | $174,800 | $79,400 | $95,400 |
| 2014 | $2,266 | $180,100 | $77,100 | $103,000 |
Source: Public Records
Map
Nearby Homes
Your Personal Tour Guide
Ask me questions while you tour the home.