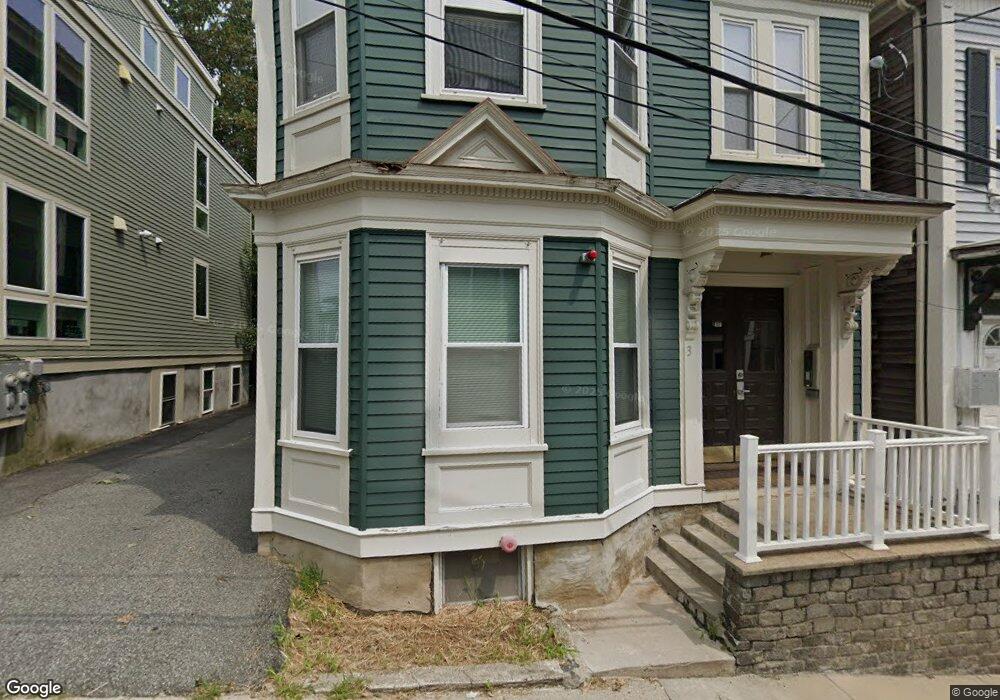
3 Alleghany St Roxbury Crossing, MA 02120
Mission Hill NeighborhoodEstimated Value: $2,309,000 - $2,551,000
4
Beds
3
Baths
9,999
Sq Ft
$241/Sq Ft
Est. Value
About This Home
This home is located at 3 Alleghany St, Roxbury Crossing, MA 02120 and is currently estimated at $2,414,333, approximately $241 per square foot. 3 Alleghany St is a home located in Suffolk County with nearby schools including Paige Academy, Malik Academy, and Manville School.
Ownership History
Date
Name
Owned For
Owner Type
Purchase Details
Closed on
Sep 21, 2012
Sold by
Kern Harold and Kern Joan A
Bought by
3 Allegheny Llc
Current Estimated Value
Home Financials for this Owner
Home Financials are based on the most recent Mortgage that was taken out on this home.
Original Mortgage
$821,848
Outstanding Balance
$569,221
Interest Rate
3.59%
Mortgage Type
Purchase Money Mortgage
Estimated Equity
$1,845,112
Create a Home Valuation Report for This Property
The Home Valuation Report is an in-depth analysis detailing your home's value as well as a comparison with similar homes in the area
Home Values in the Area
Average Home Value in this Area
Purchase History
| Date | Buyer | Sale Price | Title Company |
|---|---|---|---|
| 3 Allegheny Llc | $812,500 | -- | |
| 3 Allegheny Llc | $812,500 | -- |
Source: Public Records
Mortgage History
| Date | Status | Borrower | Loan Amount |
|---|---|---|---|
| Open | 3 Allegheny Llc | $821,848 | |
| Closed | 3 Allegheny Llc | $821,848 |
Source: Public Records
Tax History Compared to Growth
Tax History
| Year | Tax Paid | Tax Assessment Tax Assessment Total Assessment is a certain percentage of the fair market value that is determined by local assessors to be the total taxable value of land and additions on the property. | Land | Improvement |
|---|---|---|---|---|
| 2025 | $22,919 | $1,979,200 | $636,900 | $1,342,300 |
| 2024 | $20,558 | $1,886,100 | $503,800 | $1,382,300 |
| 2023 | $20,257 | $1,886,100 | $503,800 | $1,382,300 |
| 2022 | $19,920 | $1,830,900 | $489,100 | $1,341,800 |
| 2021 | $18,429 | $1,727,200 | $461,400 | $1,265,800 |
| 2020 | $17,429 | $1,650,500 | $449,900 | $1,200,600 |
| 2019 | $15,777 | $1,496,900 | $312,200 | $1,184,700 |
| 2018 | $14,520 | $1,385,500 | $312,200 | $1,073,300 |
| 2017 | $13,842 | $1,307,100 | $312,200 | $994,900 |
| 2016 | $12,503 | $1,136,600 | $312,200 | $824,400 |
| 2015 | $11,236 | $927,800 | $241,000 | $686,800 |
| 2014 | $9,937 | $789,900 | $241,000 | $548,900 |
Source: Public Records
Map
Nearby Homes
- 743 Parker St Unit 3
- 6 Fisher Ave
- 22 Fisher Ave
- 249 Roxbury St Unit 1
- 78 Fort Ave Unit 78
- 1 Centre Street Terrace Unit 7
- 10 Linwood St
- 7 Oswald St
- 51 Beech Glen St Unit 3
- 24 Sachem St
- 134-140 Smith St
- 49 Norfolk St
- 63 Beech Glen St
- 27 Dudley St
- 155-157 Hillside St
- 22 Hawthorne St Unit 2
- 92 Lawn St Unit 7-160
- 124-126 Minden St Unit 126-2
- 38 Juniper St
- 18 Eldora St
- 3 Alleghany St
- 3 Alleghany St Unit 3
- 3 Alleghany St Unit 8 BEDROOM
- 7 Alleghany St Unit 2
- 7 Alleghany St
- 7 Alleghany St Unit 4
- 7 Alleghany St Unit 1
- 7 Alleghany St Unit 3
- 7 Alleghany St
- 62 Terrace St
- 9 Alleghany St Unit 2
- 1 Alleghany St
- 1 Alleghany St Unit 1 alleghany, 1
- 1 Alleghany St Unit 1
- 1 Alleghany St Unit 3
- 1 Alleghany St
- 6 Oscar St
- 11 Alleghany St
- 11 Alleghany St Unit 12
- 11 Alleghany St Unit 11