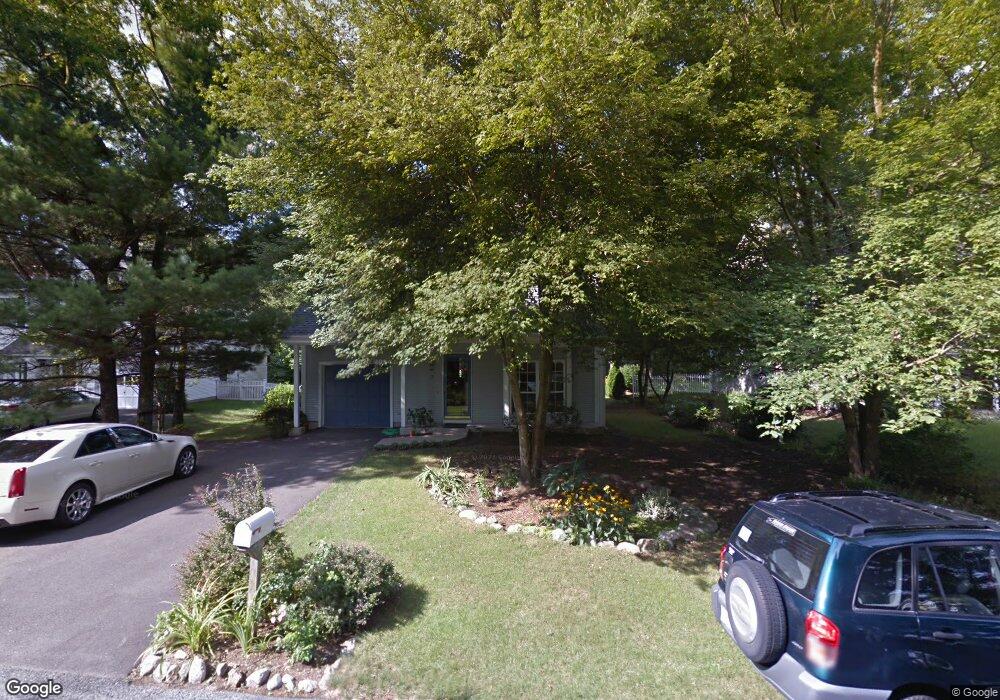
3 Balcom Dr Foxboro, MA 02035
Estimated Value: $718,165 - $785,000
2
Beds
4
Baths
1,800
Sq Ft
$409/Sq Ft
Est. Value
About This Home
This home is located at 3 Balcom Dr, Foxboro, MA 02035 and is currently estimated at $735,541, approximately $408 per square foot. 3 Balcom Dr is a home located in Norfolk County with nearby schools including Foxborough High School, Foxborough Regional Charter School, and The Sage School.
Ownership History
Date
Name
Owned For
Owner Type
Purchase Details
Closed on
Jun 26, 2006
Sold by
Meyer Grace P and Parkhurst Grace
Bought by
Elizabeth M Lorusso Re
Current Estimated Value
Purchase Details
Closed on
Apr 28, 2000
Sold by
Theberge Ann M
Bought by
Meyer William J and Meyer Grace P
Home Financials for this Owner
Home Financials are based on the most recent Mortgage that was taken out on this home.
Original Mortgage
$203,200
Interest Rate
8.23%
Mortgage Type
Purchase Money Mortgage
Purchase Details
Closed on
May 16, 1996
Sold by
Kasindorf Lisa G
Bought by
Theberge Ann M
Home Financials for this Owner
Home Financials are based on the most recent Mortgage that was taken out on this home.
Original Mortgage
$138,000
Interest Rate
7.77%
Mortgage Type
Purchase Money Mortgage
Purchase Details
Closed on
Jan 4, 1993
Sold by
Summerfield Inc
Bought by
Kasindorf Mark W and Kasindorf Lisa G
Create a Home Valuation Report for This Property
The Home Valuation Report is an in-depth analysis detailing your home's value as well as a comparison with similar homes in the area
Home Values in the Area
Average Home Value in this Area
Purchase History
| Date | Buyer | Sale Price | Title Company |
|---|---|---|---|
| Elizabeth M Lorusso Re | $433,000 | -- | |
| Meyer William J | $254,000 | -- | |
| Theberge Ann M | $189,900 | -- | |
| Kasindorf Mark W | $161,740 | -- |
Source: Public Records
Mortgage History
| Date | Status | Borrower | Loan Amount |
|---|---|---|---|
| Previous Owner | Kasindorf Mark W | $203,200 | |
| Previous Owner | Kasindorf Mark W | $139,000 | |
| Previous Owner | Kasindorf Mark W | $138,000 |
Source: Public Records
Tax History
| Year | Tax Paid | Tax Assessment Tax Assessment Total Assessment is a certain percentage of the fair market value that is determined by local assessors to be the total taxable value of land and additions on the property. | Land | Improvement |
|---|---|---|---|---|
| 2025 | $7,490 | $566,600 | $223,300 | $343,300 |
| 2024 | $7,304 | $540,600 | $227,300 | $313,300 |
| 2023 | $7,062 | $497,000 | $216,500 | $280,500 |
| 2022 | $6,498 | $447,500 | $181,600 | $265,900 |
| 2021 | $6,335 | $429,800 | $168,100 | $261,700 |
| 2020 | $6,140 | $421,400 | $168,100 | $253,300 |
| 2019 | $5,830 | $396,600 | $160,100 | $236,500 |
| 2018 | $5,687 | $390,300 | $160,100 | $230,200 |
| 2017 | $5,494 | $365,300 | $149,700 | $215,600 |
| 2016 | $5,464 | $368,700 | $150,800 | $217,900 |
| 2015 | $5,409 | $356,100 | $127,600 | $228,500 |
| 2014 | $5,148 | $343,400 | $119,200 | $224,200 |
Source: Public Records
Map
Nearby Homes
- 9 Independence Dr Unit 9
- 3 Wampanoag Rd
- 1 Maura Elizabeth Ln
- 3 Willow St
- 2 Foxfire Dr
- 165 Chestnut St Unit 2
- 147 Chestnut St Unit A
- 147 Chestnut St Unit B
- 261 East St
- 668 S Main St
- 13 Summerville Rd Unit 13
- 26 Fuller Rd Unit 6
- 174 E Foxboro St
- 73 Ridge Rd
- 233 Central St
- 157 Central St
- 180 Old Post Rd Unit 202
- 180 Old Post Rd Unit 206
- 180 Old Post Rd Unit 308
- 180 Old Post Rd Unit 201
Your Personal Tour Guide
Ask me questions while you tour the home.