3 Bartlett Place Rd Bartlett, NH 03812
Estimated Value: $513,000 - $626,000
3
Beds
3
Baths
2,051
Sq Ft
$271/Sq Ft
Est. Value
About This Home
This home is located at 3 Bartlett Place Rd, Bartlett, NH 03812 and is currently estimated at $556,070, approximately $271 per square foot. 3 Bartlett Place Rd is a home located in Carroll County with nearby schools including Josiah Bartlett Elementary School.
Ownership History
Date
Name
Owned For
Owner Type
Purchase Details
Closed on
Mar 11, 2015
Sold by
Lorber Matthew and Lorber Margaret S
Bought by
Bridgeman Michael J and Bridgeman Catherine M
Current Estimated Value
Home Financials for this Owner
Home Financials are based on the most recent Mortgage that was taken out on this home.
Original Mortgage
$175,000
Outstanding Balance
$133,983
Interest Rate
3.67%
Estimated Equity
$422,087
Purchase Details
Closed on
May 28, 2013
Sold by
Brunelle James Thomas and Smith Brian Francis
Bought by
Lorber Matthew and Lorber Margaret Susan
Purchase Details
Closed on
Feb 5, 2010
Sold by
Lorber Matthew and Lorber Margaret Susan
Bought by
Brunelle James Thomas and Smith Brian Francis
Home Financials for this Owner
Home Financials are based on the most recent Mortgage that was taken out on this home.
Original Mortgage
$198,000
Interest Rate
5.05%
Mortgage Type
Purchase Money Mortgage
Create a Home Valuation Report for This Property
The Home Valuation Report is an in-depth analysis detailing your home's value as well as a comparison with similar homes in the area
Home Values in the Area
Average Home Value in this Area
Purchase History
| Date | Buyer | Sale Price | Title Company |
|---|---|---|---|
| Bridgeman Michael J | $225,000 | -- | |
| Lorber Matthew | $259,900 | -- | |
| Brunelle James Thomas | $220,000 | -- |
Source: Public Records
Mortgage History
| Date | Status | Borrower | Loan Amount |
|---|---|---|---|
| Open | Bridgeman Michael J | $175,000 | |
| Previous Owner | Brunelle James Thomas | $198,000 |
Source: Public Records
Tax History
| Year | Tax Paid | Tax Assessment Tax Assessment Total Assessment is a certain percentage of the fair market value that is determined by local assessors to be the total taxable value of land and additions on the property. | Land | Improvement |
|---|---|---|---|---|
| 2024 | $2,513 | $450,300 | $0 | $450,300 |
| 2023 | $2,324 | $450,300 | $0 | $450,300 |
| 2022 | $2,238 | $450,300 | $0 | $450,300 |
| 2021 | $2,182 | $229,000 | $0 | $229,000 |
| 2020 | $2,212 | $229,000 | $0 | $229,000 |
| 2019 | $2,139 | $229,000 | $0 | $229,000 |
| 2018 | $2,091 | $229,000 | $0 | $229,000 |
| 2016 | $2,046 | $215,400 | $0 | $215,400 |
| 2015 | $2,055 | $215,400 | $0 | $215,400 |
| 2014 | $2,109 | $215,400 | $0 | $215,400 |
| 2010 | $1,938 | $211,800 | $0 | $211,800 |
Source: Public Records
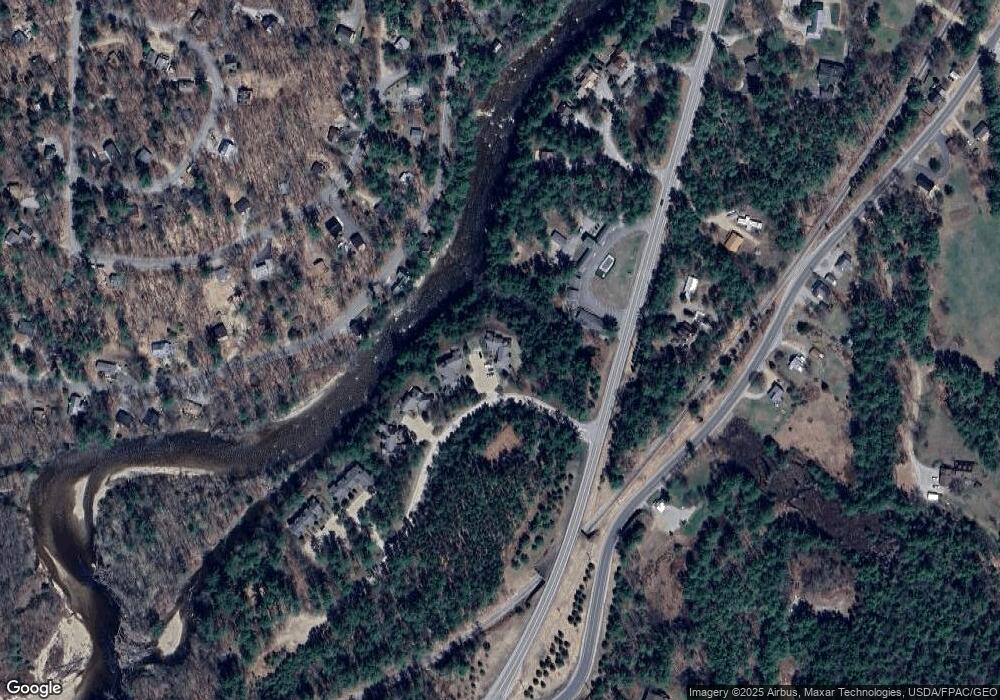
Map
Nearby Homes
- 18 Seasons at Attitash Rd
- 2 Seasons at Attitash Rd
- 31 Cave Mountain Rd
- 17 The Meadows Rd
- 19 Marsden Dr
- 12 Attitash Woods
- 9 River Run Dr Unit 9I
- 1 River Run Rd Unit 1-O
- 1 River Run Dr Unit Week 43 - Oct. 25-No
- 8 River Run Dr Unit T
- 8 River Run Dr Unit H
- 10 River Run Dr Unit G
- 15 Ridgewood Rd
- 00 Tall Woods Loop Unit 9
- 63 W Side Woods Rd
- 25 Linderhof Strauss Rd
- 201 Glen Ledge Rd
- 89 Nearledge Rd Unit 10
- 24 N Ledge Rd
- 38 Iron Ledge Rd
- 14 Glen Land Unit 14
- 14 Bartlett Place Unit 14
- 14 Bartlett Place
- 7 Bartlett Place Rd Unit 7
- 27 Bartlett Place
- 21 Bartlett Place
- 12 Bartlett Place Rd
- 12 Bartlett Place Rd Unit 12
- 17 Bartlett Place Rd Unit 17
- 17 Bartlett Place Rd
- 1 Bartlett Place Rd Unit 1
- 18 Bartlett Place Rd Unit 18
- 10 Bartlett Place Rd
- 10 Bartlett Place Rd Unit 10
- 9 Bartlett Place
- 9 Bartlett Place Rd Unit 9
- 9 Bartlett Place Rd
- 20 Bartlett Place Rd
- 6 Bartlett Place Unit 6
- 23 Bartlett Place Rd
Your Personal Tour Guide
Ask me questions while you tour the home.