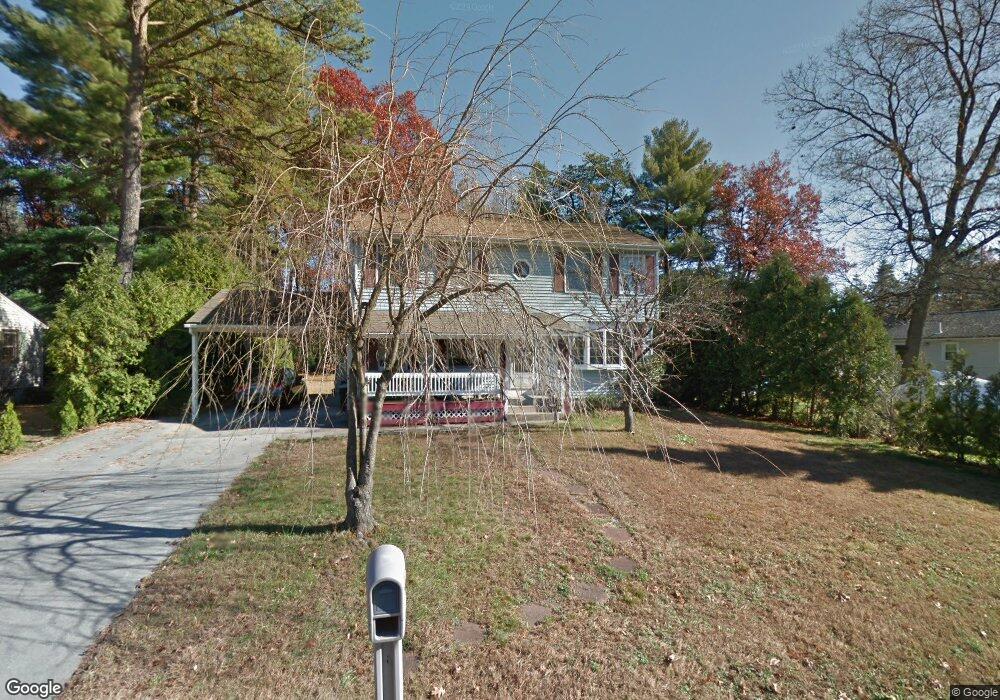
3 Bien Cir Easthampton, MA 01027
Estimated Value: $408,000 - $452,000
4
Beds
3
Baths
1,784
Sq Ft
$239/Sq Ft
Est. Value
About This Home
This home is located at 3 Bien Cir, Easthampton, MA 01027 and is currently estimated at $426,960, approximately $239 per square foot. 3 Bien Cir is a home located in Hampshire County with nearby schools including Easthampton High School, Calvary Baptist Christian School, and Tri-County Schools.
Ownership History
Date
Name
Owned For
Owner Type
Purchase Details
Closed on
Apr 19, 2013
Sold by
Bilodeau Aline R
Bought by
Bilodeau Aline R and Fitz-Gibbon Taurie R
Current Estimated Value
Home Financials for this Owner
Home Financials are based on the most recent Mortgage that was taken out on this home.
Original Mortgage
$180,000
Outstanding Balance
$127,343
Interest Rate
3.52%
Mortgage Type
New Conventional
Estimated Equity
$299,617
Create a Home Valuation Report for This Property
The Home Valuation Report is an in-depth analysis detailing your home's value as well as a comparison with similar homes in the area
Home Values in the Area
Average Home Value in this Area
Purchase History
| Date | Buyer | Sale Price | Title Company |
|---|---|---|---|
| Bilodeau Aline R | -- | -- |
Source: Public Records
Mortgage History
| Date | Status | Borrower | Loan Amount |
|---|---|---|---|
| Open | Bilodeau Aline R | $180,000 | |
| Previous Owner | Bilodeau Aline R | $184,000 |
Source: Public Records
Tax History Compared to Growth
Tax History
| Year | Tax Paid | Tax Assessment Tax Assessment Total Assessment is a certain percentage of the fair market value that is determined by local assessors to be the total taxable value of land and additions on the property. | Land | Improvement |
|---|---|---|---|---|
| 2025 | $4,727 | $345,800 | $120,400 | $225,400 |
| 2024 | $4,559 | $336,200 | $117,000 | $219,200 |
| 2023 | $3,459 | $236,100 | $91,800 | $144,300 |
| 2022 | $3,903 | $236,100 | $91,800 | $144,300 |
| 2021 | $4,278 | $243,900 | $91,800 | $152,100 |
| 2020 | $4,193 | $236,100 | $91,800 | $144,300 |
| 2019 | $3,602 | $233,000 | $91,800 | $141,200 |
| 2018 | $3,470 | $216,900 | $86,600 | $130,300 |
| 2017 | $3,388 | $209,000 | $83,400 | $125,600 |
| 2016 | $3,514 | $225,400 | $83,400 | $142,000 |
| 2015 | $3,415 | $225,400 | $83,400 | $142,000 |
Source: Public Records
Map
Nearby Homes