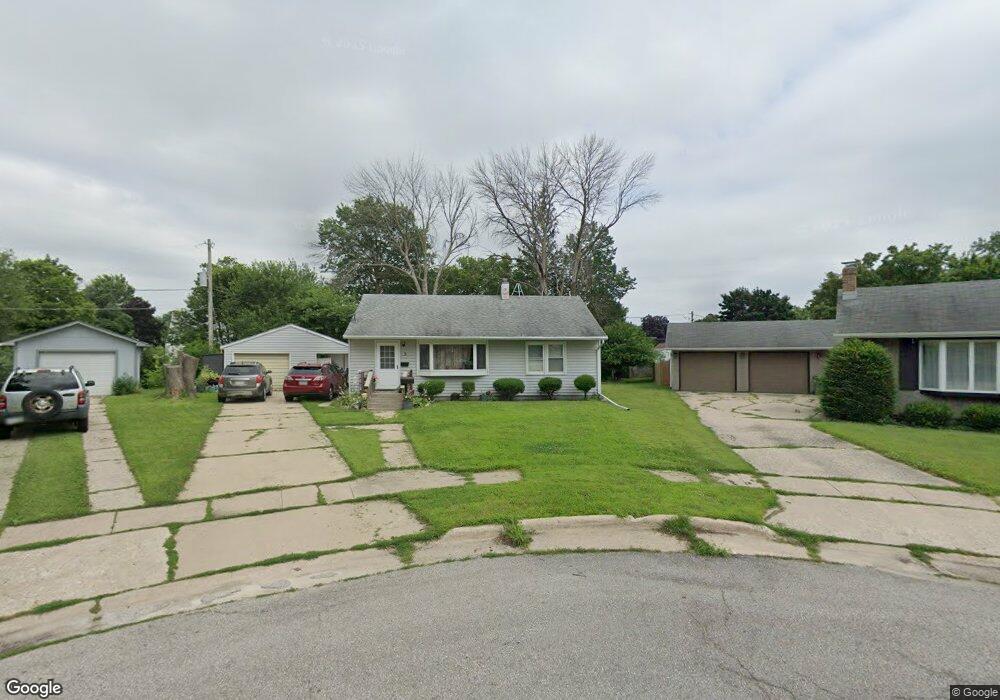
3 Bird Cir Charles City, IA 50616
Estimated Value: $78,000 - $104,000
2
Beds
2
Baths
864
Sq Ft
$105/Sq Ft
Est. Value
About This Home
This home is located at 3 Bird Cir, Charles City, IA 50616 and is currently estimated at $90,495, approximately $104 per square foot. 3 Bird Cir is a home located in Floyd County with nearby schools including Charles City High School and Immaculate Conception School.
Ownership History
Date
Name
Owned For
Owner Type
Purchase Details
Closed on
Dec 13, 2016
Sold by
Hbi Llc
Bought by
Jensen John D and Jensen Kim M
Current Estimated Value
Purchase Details
Closed on
Nov 18, 2016
Sold by
Reo Asset Management Company Llc
Bought by
Bllc Hbi
Purchase Details
Closed on
Sep 12, 2006
Sold by
Groth Kristyn and Groth Marjori M
Bought by
Vaine Gilman F and Vaine Ruth E
Home Financials for this Owner
Home Financials are based on the most recent Mortgage that was taken out on this home.
Original Mortgage
$50,500
Interest Rate
6.59%
Mortgage Type
New Conventional
Create a Home Valuation Report for This Property
The Home Valuation Report is an in-depth analysis detailing your home's value as well as a comparison with similar homes in the area
Home Values in the Area
Average Home Value in this Area
Purchase History
| Date | Buyer | Sale Price | Title Company |
|---|---|---|---|
| Jensen John D | $30,000 | None Available | |
| Bllc Hbi | $57,000 | None Available | |
| Reo Asset Management Company Llc | -- | None Available | |
| Vaine Gilman F | $50,500 | None Available |
Source: Public Records
Mortgage History
| Date | Status | Borrower | Loan Amount |
|---|---|---|---|
| Previous Owner | Vaine Gilman F | $50,500 |
Source: Public Records
Tax History Compared to Growth
Tax History
| Year | Tax Paid | Tax Assessment Tax Assessment Total Assessment is a certain percentage of the fair market value that is determined by local assessors to be the total taxable value of land and additions on the property. | Land | Improvement |
|---|---|---|---|---|
| 2025 | $1,416 | $85,800 | $11,540 | $74,260 |
| 2024 | $1,416 | $79,600 | $11,540 | $68,060 |
| 2023 | $1,306 | $79,600 | $11,540 | $68,060 |
| 2022 | $1,300 | $61,910 | $11,540 | $50,370 |
| 2021 | $1,308 | $61,910 | $11,540 | $50,370 |
| 2020 | $1,308 | $61,910 | $11,540 | $50,370 |
| 2019 | $1,310 | $64,300 | $11,540 | $52,760 |
| 2018 | $1,222 | $61,500 | $11,540 | $49,960 |
| 2017 | $1,006 | $61,500 | $11,540 | $49,960 |
| 2016 | $982 | $61,500 | $11,540 | $49,960 |
| 2015 | $982 | $61,400 | $11,540 | $49,860 |
| 2014 | $1,006 | $61,400 | $11,540 | $49,860 |
Source: Public Records
Map
Nearby Homes