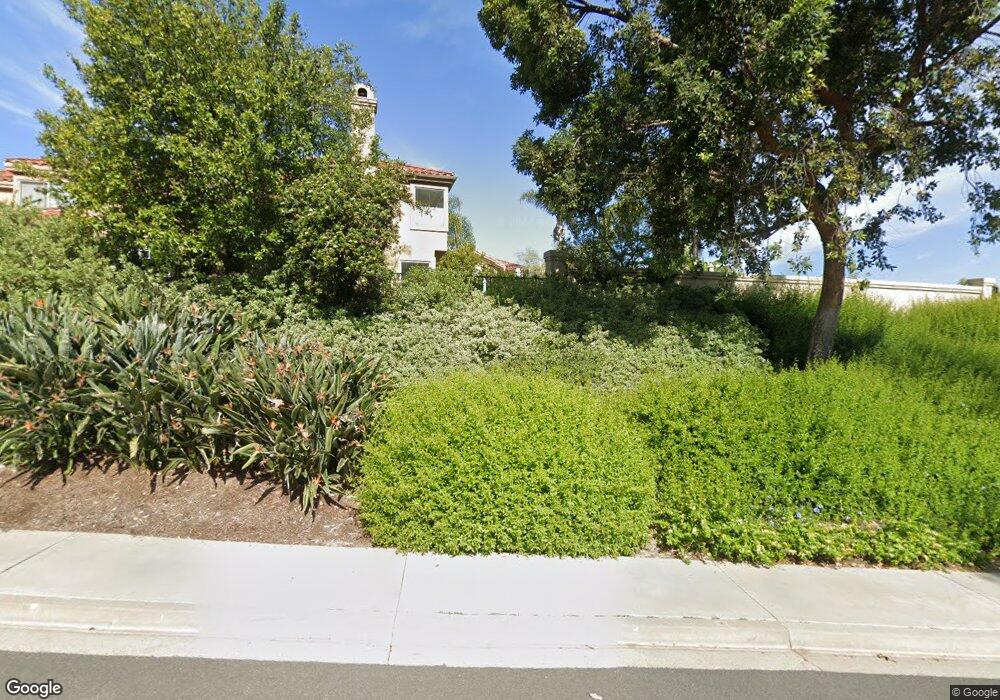
3 Brindisi Laguna Niguel, CA 92677
Marina Hills NeighborhoodEstimated Value: $1,834,210 - $2,750,000
3
Beds
3
Baths
2,883
Sq Ft
$802/Sq Ft
Est. Value
About This Home
This home is located at 3 Brindisi, Laguna Niguel, CA 92677 and is currently estimated at $2,312,303, approximately $802 per square foot. 3 Brindisi is a home located in Orange County with nearby schools including George White Elementary, Niguel Hills Middle School, and Dana Hills High School.
Ownership History
Date
Name
Owned For
Owner Type
Purchase Details
Closed on
Apr 5, 2018
Sold by
Ward Steven V and Ward Kathy M
Bought by
Ward Steven V and Ward Kathy M
Current Estimated Value
Purchase Details
Closed on
Jun 3, 2013
Sold by
Ward Steven Vaughn and Ward Kathy Marie
Bought by
Ward Steven and Ward Kathy M
Purchase Details
Closed on
Mar 11, 2011
Sold by
Ward Steven V and Ward Kathy M
Bought by
Ward Steven Vaughn and Ward Kathy Marie
Purchase Details
Closed on
Dec 11, 2009
Sold by
Ward Steven V and Ward Kathy M
Bought by
Ward Steven and Ward Kathy M
Create a Home Valuation Report for This Property
The Home Valuation Report is an in-depth analysis detailing your home's value as well as a comparison with similar homes in the area
Home Values in the Area
Average Home Value in this Area
Purchase History
| Date | Buyer | Sale Price | Title Company |
|---|---|---|---|
| Ward Steven V | -- | None Available | |
| Ward Steven | -- | None Available | |
| Ward Steven Vaughn | -- | None Available | |
| Ward Steven | -- | None Available |
Source: Public Records
Tax History Compared to Growth
Tax History
| Year | Tax Paid | Tax Assessment Tax Assessment Total Assessment is a certain percentage of the fair market value that is determined by local assessors to be the total taxable value of land and additions on the property. | Land | Improvement |
|---|---|---|---|---|
| 2025 | $5,335 | $709,069 | $343,267 | $365,802 |
| 2024 | $5,335 | $695,166 | $336,536 | $358,630 |
| 2023 | $5,276 | $681,536 | $329,937 | $351,599 |
| 2022 | $5,256 | $668,173 | $323,468 | $344,705 |
| 2021 | $5,150 | $655,072 | $317,125 | $337,947 |
| 2020 | $5,126 | $648,356 | $313,874 | $334,482 |
| 2019 | $5,036 | $635,644 | $307,720 | $327,924 |
| 2018 | $4,960 | $623,181 | $301,686 | $321,495 |
| 2017 | $4,875 | $610,962 | $295,770 | $315,192 |
| 2016 | $4,790 | $598,983 | $289,971 | $309,012 |
| 2015 | $4,709 | $589,986 | $285,615 | $304,371 |
| 2014 | -- | $578,429 | $280,020 | $298,409 |
Source: Public Records
Map
Nearby Homes