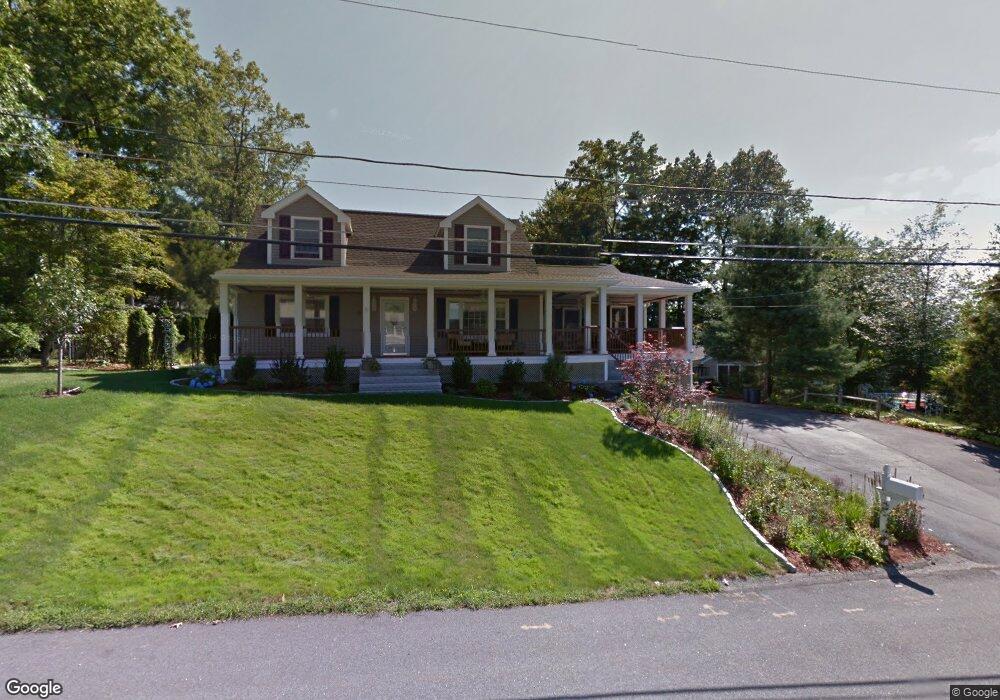
3 Bryant Rd Nashua, NH 03062
Southwest Nashua NeighborhoodEstimated Value: $574,258 - $646,000
4
Beds
2
Baths
1,816
Sq Ft
$332/Sq Ft
Est. Value
About This Home
This home is located at 3 Bryant Rd, Nashua, NH 03062 and is currently estimated at $603,315, approximately $332 per square foot. 3 Bryant Rd is a home located in Hillsborough County with nearby schools including Bicentennial Elementary School, Fairgrounds Middle School, and Nashua High School South.
Ownership History
Date
Name
Owned For
Owner Type
Purchase Details
Closed on
Jun 30, 2017
Sold by
Raymond E E and Raymond F M
Bought by
Plourde Ryan D and Plourde Stephanie M
Current Estimated Value
Home Financials for this Owner
Home Financials are based on the most recent Mortgage that was taken out on this home.
Original Mortgage
$240,000
Outstanding Balance
$197,701
Interest Rate
4.02%
Mortgage Type
New Conventional
Estimated Equity
$405,614
Purchase Details
Closed on
Jul 10, 2006
Sold by
Moreau Diane Morgan
Bought by
Colburn Jeffrey Todd
Home Financials for this Owner
Home Financials are based on the most recent Mortgage that was taken out on this home.
Original Mortgage
$357,422
Interest Rate
6.6%
Mortgage Type
Purchase Money Mortgage
Create a Home Valuation Report for This Property
The Home Valuation Report is an in-depth analysis detailing your home's value as well as a comparison with similar homes in the area
Home Values in the Area
Average Home Value in this Area
Purchase History
| Date | Buyer | Sale Price | Title Company |
|---|---|---|---|
| Plourde Ryan D | $300,000 | -- | |
| Colburn Jeffrey Todd | $349,900 | -- |
Source: Public Records
Mortgage History
| Date | Status | Borrower | Loan Amount |
|---|---|---|---|
| Open | Plourde Ryan D | $240,000 | |
| Previous Owner | Colburn Jeffrey Todd | $364,413 | |
| Previous Owner | Colburn Jeffrey Todd | $357,422 | |
| Previous Owner | Colburn Jeffrey Todd | $272,500 |
Source: Public Records
Tax History
| Year | Tax Paid | Tax Assessment Tax Assessment Total Assessment is a certain percentage of the fair market value that is determined by local assessors to be the total taxable value of land and additions on the property. | Land | Improvement |
|---|---|---|---|---|
| 2025 | $9,327 | $554,200 | $168,400 | $385,800 |
| 2024 | $8,812 | $554,200 | $168,400 | $385,800 |
| 2023 | $8,450 | $463,500 | $134,800 | $328,700 |
| 2022 | $8,375 | $463,500 | $134,800 | $328,700 |
| 2021 | $7,809 | $336,300 | $98,800 | $237,500 |
| 2020 | $7,502 | $331,800 | $98,800 | $233,000 |
| 2019 | $7,220 | $331,800 | $98,800 | $233,000 |
| 2018 | $6,444 | $303,800 | $98,800 | $205,000 |
| 2017 | $6,174 | $239,400 | $85,200 | $154,200 |
| 2016 | $6,002 | $239,400 | $85,200 | $154,200 |
| 2015 | $5,872 | $239,400 | $85,200 | $154,200 |
| 2014 | $5,724 | $238,000 | $85,200 | $152,800 |
Source: Public Records
Map
Nearby Homes
- 12 Oakdale Ave
- 16 Emerson Rd
- 21 Clearview Dr
- 3 Appaloosa Place
- 8 Collier Ct
- 4 Nightingale Rd
- 22 Taschereau Blvd
- 20 Nightingale Rd
- 2 Doncaster Dr
- 1 Thompson Rd Unit 109
- 4 Chelsea Ct
- 25 E Dunstable Rd
- 154 Westwood Dr
- 6 Hayden St
- 20 Salmon Brook Dr
- 70 Tenby Dr
- 23 Eastman St
- 397 S Main St
- 2 Prestwick Trail Unit U8
- 2 Prestwick Trail Unit 2
Your Personal Tour Guide
Ask me questions while you tour the home.