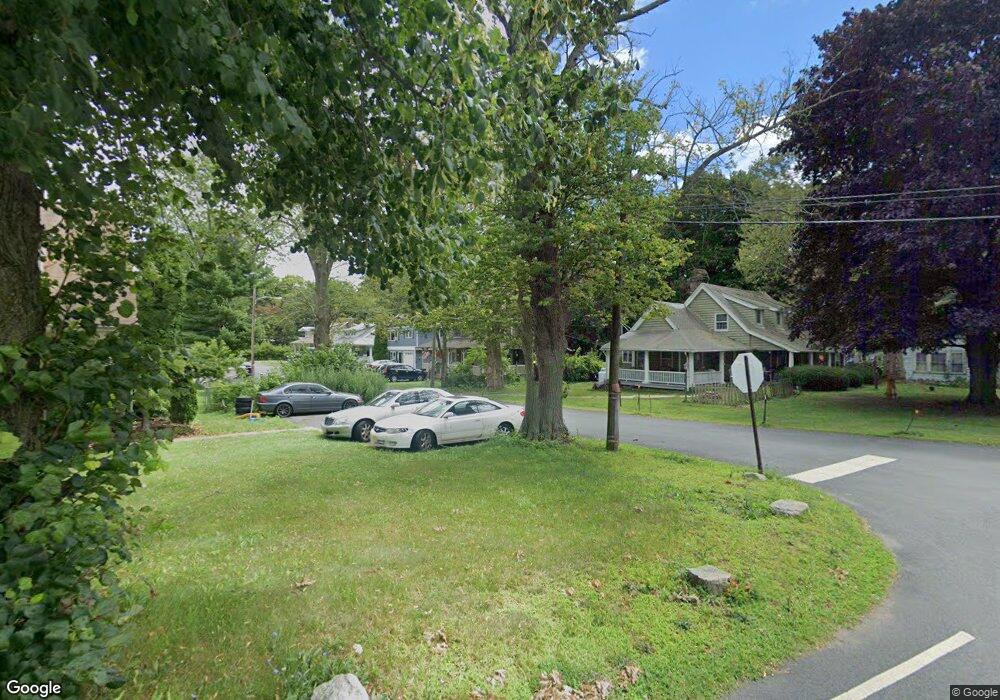
3 Budd Ave Budd Lake, NJ 07828
Estimated Value: $366,000 - $551,000
--
Bed
--
Bath
1,251
Sq Ft
$353/Sq Ft
Est. Value
About This Home
This home is located at 3 Budd Ave, Budd Lake, NJ 07828 and is currently estimated at $441,417, approximately $352 per square foot. 3 Budd Ave is a home located in Morris County with nearby schools including Mt Olive Middle School and Mount Olive High School.
Ownership History
Date
Name
Owned For
Owner Type
Purchase Details
Closed on
Nov 8, 2011
Sold by
Oneill Charles and Oneill Maureen
Bought by
Bowen Ryan and Bowen Tiffany
Current Estimated Value
Home Financials for this Owner
Home Financials are based on the most recent Mortgage that was taken out on this home.
Original Mortgage
$156,060
Outstanding Balance
$105,903
Interest Rate
3.92%
Mortgage Type
New Conventional
Estimated Equity
$335,514
Purchase Details
Closed on
Apr 18, 2002
Sold by
O'Toole John
Bought by
O'Neill Charles and O'Neill Maureen
Home Financials for this Owner
Home Financials are based on the most recent Mortgage that was taken out on this home.
Original Mortgage
$191,002
Interest Rate
7.18%
Mortgage Type
FHA
Purchase Details
Closed on
Dec 28, 1995
Sold by
Altegra Credit Company
Bought by
Otoole John P and Otoole Patricia K
Create a Home Valuation Report for This Property
The Home Valuation Report is an in-depth analysis detailing your home's value as well as a comparison with similar homes in the area
Home Values in the Area
Average Home Value in this Area
Purchase History
| Date | Buyer | Sale Price | Title Company |
|---|---|---|---|
| Bowen Ryan | $148,400 | None Available | |
| O'Neill Charles | $194,000 | -- | |
| Otoole John P | $60,000 | First American Title Ins Co |
Source: Public Records
Mortgage History
| Date | Status | Borrower | Loan Amount |
|---|---|---|---|
| Open | Bowen Ryan | $156,060 | |
| Previous Owner | O'Neill Charles | $191,002 |
Source: Public Records
Tax History Compared to Growth
Tax History
| Year | Tax Paid | Tax Assessment Tax Assessment Total Assessment is a certain percentage of the fair market value that is determined by local assessors to be the total taxable value of land and additions on the property. | Land | Improvement |
|---|---|---|---|---|
| 2025 | $7,615 | $218,500 | $112,100 | $106,400 |
| 2024 | $7,182 | $218,500 | $112,100 | $106,400 |
| 2023 | $7,182 | $218,500 | $112,100 | $106,400 |
| 2022 | $7,087 | $218,500 | $112,100 | $106,400 |
| 2021 | $7,087 | $218,500 | $112,100 | $106,400 |
| 2020 | $7,239 | $218,500 | $112,100 | $106,400 |
| 2019 | $7,215 | $218,500 | $112,100 | $106,400 |
| 2018 | $7,145 | $218,500 | $112,100 | $106,400 |
| 2017 | $7,020 | $218,500 | $112,100 | $106,400 |
| 2016 | $6,798 | $218,500 | $112,100 | $106,400 |
| 2015 | $6,957 | $218,500 | $112,100 | $106,400 |
| 2014 | $6,964 | $218,500 | $112,100 | $106,400 |
Source: Public Records
Map
Nearby Homes