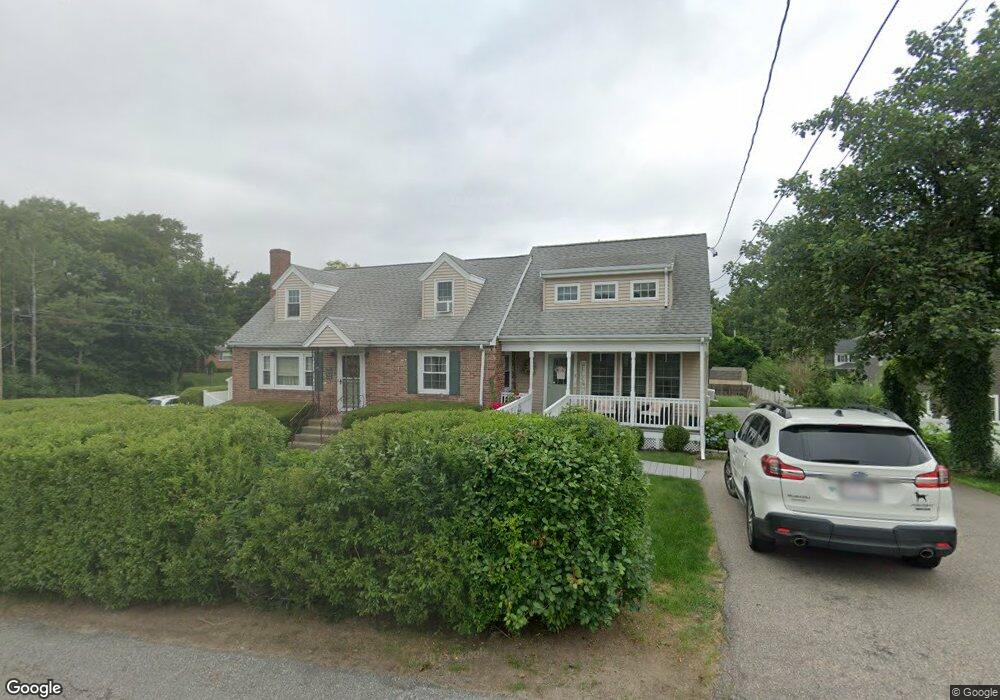
3 Burrill St Walpole, MA 02081
Estimated Value: $691,000 - $728,000
About This Home
This home is located at 3 Burrill St, Walpole, MA 02081 and is currently estimated at $709,838, approximately $318 per square foot. 3 Burrill St is a home located in Norfolk County with nearby schools including Fisher School, Walpole Middle School, and Walpole High School.
Ownership History
We collect this data history from publicly available records. To have your information removed, we recommend requesting removal directly through your county’s website.
Purchase Details
Purchase Details
Home Values in the Area
Average Home Value in this Area
Purchase History
We collect this data history from publicly available records. To have your information removed, we recommend requesting removal directly through your county’s website.
| Date | Buyer | Sale Price | Title Company |
|---|---|---|---|
| -- | None Available | ||
| $152,000 | -- |
Mortgage History
We collect this data history from publicly available records. To have your information removed, we recommend requesting removal directly through your county’s website.
| Date | Status | Borrower | Loan Amount |
|---|---|---|---|
| Previous Owner | $185,500 | ||
| Previous Owner | $190,500 | ||
| Previous Owner | $130,000 |
Tax History
We collect this data history from publicly available records. To have your information removed, we recommend requesting removal directly through your county’s website.
| Year | Tax Paid | Tax Assessment Tax Assessment Total Assessment is a certain percentage of the fair market value that is determined by local assessors to be the total taxable value of land and additions on the property. | Land | Improvement |
|---|---|---|---|---|
| 2025 | $7,966 | $620,900 | $274,300 | $346,600 |
| 2024 | $7,706 | $582,900 | $263,700 | $319,200 |
| 2023 | $7,430 | $534,900 | $229,300 | $305,600 |
| 2022 | $7,002 | $484,200 | $212,300 | $271,900 |
| 2021 | $6,564 | $442,300 | $200,300 | $242,000 |
| 2020 | $6,248 | $416,800 | $179,000 | $237,800 |
| 2019 | $6,076 | $402,400 | $172,200 | $230,200 |
| 2018 | $5,661 | $370,700 | $156,500 | $214,200 |
| 2017 | $5,473 | $357,000 | $150,500 | $206,500 |
| 2016 | $5,480 | $352,200 | $153,200 | $199,000 |
| 2015 | $5,038 | $320,900 | $129,500 | $191,400 |
| 2014 | $4,819 | $305,800 | $129,500 | $176,300 |
Map
- 31 Congress St
- 121 Mylod St
- 118 Bruce Rd
- 64 Main St
- 17 Rose Court Way
- 34 Washington Green Unit 6
- 448 Washington St
- 269 Bullard St
- 20 Cinnamon Cir
- 8 Lewis Park Dr S
- 4 Meadow Ln
- 535 Walpole St
- 84 Walnut St
- 2301 Pennington Dr Unit 2301
- 2305 Pennington Dr Unit 305
- 94 High St
- 7 Ivy Cir
- 1108 Pennington Dr Unit 1108
- 521 Walpole St
- 29 Pilgrim Way
Ask me questions while you tour the home.