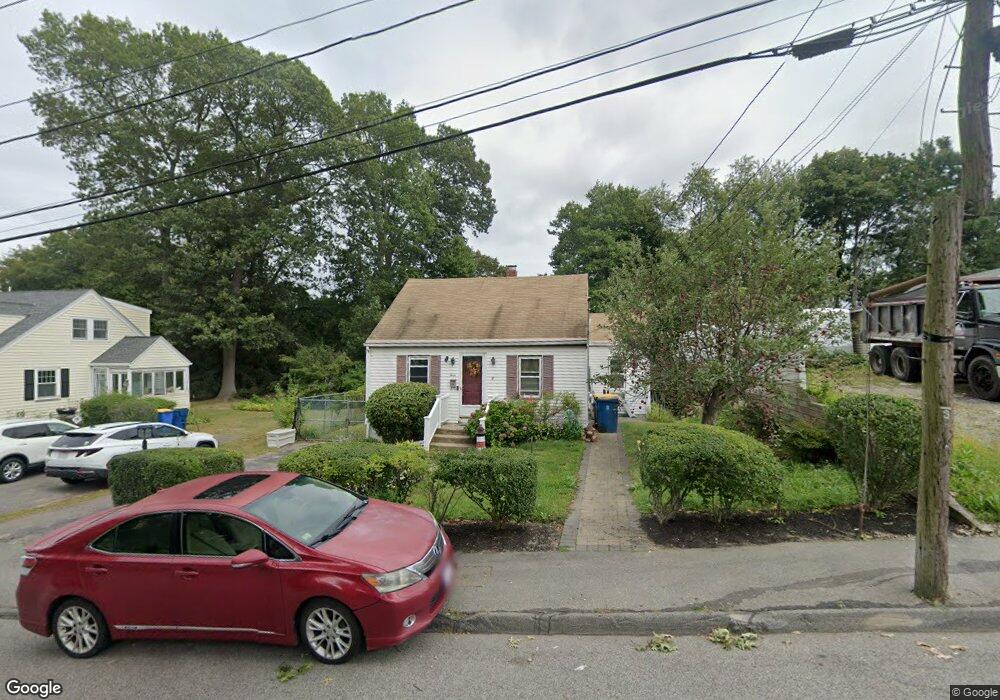
3 Byron St Randolph, MA 02368
North Randolph NeighborhoodEstimated Value: $489,485 - $534,000
4
Beds
2
Baths
1,032
Sq Ft
$497/Sq Ft
Est. Value
About This Home
This home is located at 3 Byron St, Randolph, MA 02368 and is currently estimated at $513,371, approximately $497 per square foot. 3 Byron St is a home located in Norfolk County with nearby schools including Randolph High School, Boston Higashi School, and Lighthouse Baptist Christian Academy.
Ownership History
Date
Name
Owned For
Owner Type
Purchase Details
Closed on
Feb 22, 1978
Bought by
Nathan Harry and Nathan Susan D
Current Estimated Value
Create a Home Valuation Report for This Property
The Home Valuation Report is an in-depth analysis detailing your home's value as well as a comparison with similar homes in the area
Home Values in the Area
Average Home Value in this Area
Purchase History
We collect this data history from publicly available records. To have your information removed, we recommend requesting removal directly through your county’s website.
| Date | Buyer | Sale Price | Title Company |
|---|---|---|---|
| Nathan Harry | -- | -- |
Source: Public Records
Mortgage History
We collect this data history from publicly available records. To have your information removed, we recommend requesting removal directly through your county’s website.
| Date | Status | Borrower | Loan Amount |
|---|---|---|---|
| Open | Nathan Harry | $31,000 | |
| Closed | Nathan Harry | $70,000 |
Source: Public Records
Tax History
| Year | Tax Paid | Tax Assessment Tax Assessment Total Assessment is a certain percentage of the fair market value that is determined by local assessors to be the total taxable value of land and additions on the property. | Land | Improvement |
|---|---|---|---|---|
| 2025 | $4,838 | $416,700 | $224,300 | $192,400 |
| 2024 | $4,681 | $408,800 | $219,900 | $188,900 |
| 2023 | $4,507 | $373,100 | $199,900 | $173,200 |
| 2022 | $4,491 | $330,200 | $166,600 | $163,600 |
| 2021 | $4,165 | $281,800 | $138,800 | $143,000 |
| 2020 | $4,203 | $281,900 | $138,800 | $143,100 |
| 2019 | $4,001 | $267,100 | $132,200 | $134,900 |
| 2018 | $3,792 | $238,800 | $120,200 | $118,600 |
| 2017 | $3,742 | $231,300 | $114,400 | $116,900 |
| 2016 | $3,570 | $205,300 | $104,000 | $101,300 |
| 2015 | $3,486 | $192,600 | $99,000 | $93,600 |
Source: Public Records
Map
Nearby Homes
- 19 Clark St
- 33 Clark St Unit A
- 20 Jasper Ln
- 12 Jasper Ln Unit 12
- 52 Jasper Ln
- 156 Allen St
- 181 Oak St
- 93 Cross St
- 24 Nelson Dr Unit 2D
- 17 Norroway Ave
- 35 Pearl St Unit 35
- 26 Mcdevitt Rd
- 240 Grove St
- 236 Chestnut St
- 71 Pond Ln
- 23 Emily Jeffers Rd
- 131 Old St
- 14 Lewis Rd
- 64 North St
- 1 Royal Crest Dr Unit 3
Your Personal Tour Guide
Ask me questions while you tour the home.