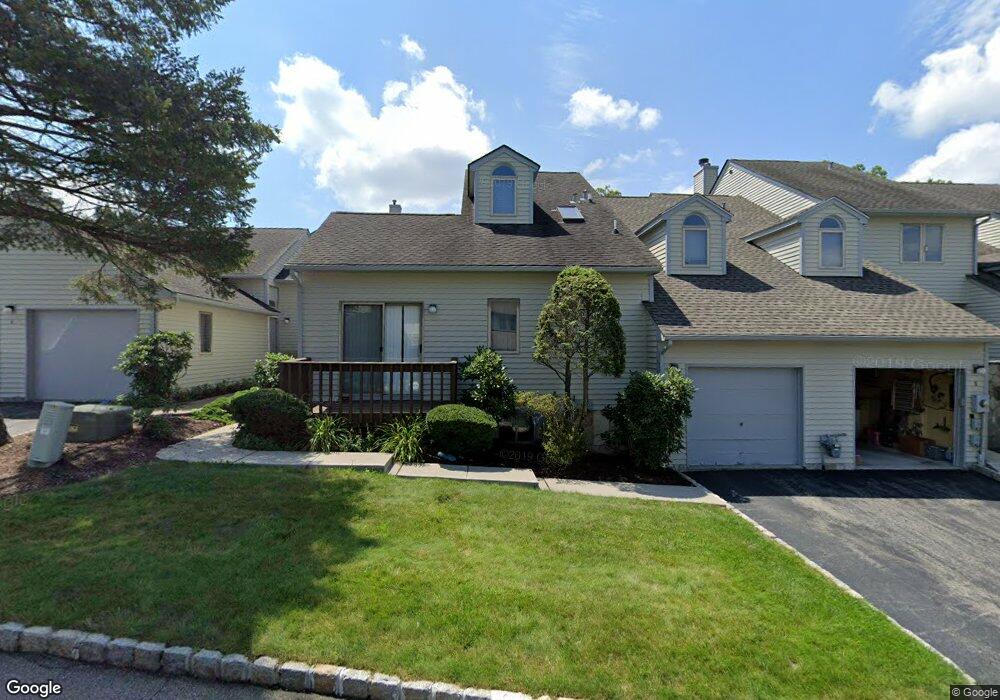
3 Cadmus Ct West Orange, NJ 07052
Estimated Value: $623,000 - $665,531
5
Beds
4
Baths
1,925
Sq Ft
$333/Sq Ft
Est. Value
About This Home
This home is located at 3 Cadmus Ct, West Orange, NJ 07052 and is currently estimated at $640,883, approximately $332 per square foot. 3 Cadmus Ct is a home located in Essex County with nearby schools including West Orange High School, Our Lady of the Lake School, and Mount Carmel Guild High School.
Ownership History
Date
Name
Owned For
Owner Type
Purchase Details
Closed on
Aug 5, 1999
Sold by
Auentzel Gerald
Bought by
Weinberg Lorraine
Current Estimated Value
Home Financials for this Owner
Home Financials are based on the most recent Mortgage that was taken out on this home.
Original Mortgage
$125,000
Interest Rate
8.1%
Purchase Details
Closed on
Nov 16, 1989
Sold by
West Essex Highlands Inc
Bought by
Quentzel Gerald H
Create a Home Valuation Report for This Property
The Home Valuation Report is an in-depth analysis detailing your home's value as well as a comparison with similar homes in the area
Home Values in the Area
Average Home Value in this Area
Purchase History
| Date | Buyer | Sale Price | Title Company |
|---|---|---|---|
| Weinberg Lorraine | $260,000 | -- | |
| Quentzel Gerald H | $215,500 | -- |
Source: Public Records
Mortgage History
| Date | Status | Borrower | Loan Amount |
|---|---|---|---|
| Previous Owner | Weinberg Lorraine | $125,000 |
Source: Public Records
Tax History Compared to Growth
Tax History
| Year | Tax Paid | Tax Assessment Tax Assessment Total Assessment is a certain percentage of the fair market value that is determined by local assessors to be the total taxable value of land and additions on the property. | Land | Improvement |
|---|---|---|---|---|
| 2025 | $17,192 | $537,400 | $230,000 | $307,400 |
| 2024 | $17,192 | $373,900 | $115,000 | $258,900 |
| 2022 | $16,590 | $373,900 | $115,000 | $258,900 |
| 2021 | $16,280 | $373,900 | $115,000 | $258,900 |
| 2020 | $16,018 | $373,900 | $115,000 | $258,900 |
| 2019 | $15,558 | $373,900 | $115,000 | $258,900 |
| 2018 | $15,098 | $373,900 | $115,000 | $258,900 |
| 2017 | $14,904 | $373,900 | $115,000 | $258,900 |
| 2016 | $14,545 | $373,900 | $115,000 | $258,900 |
| 2015 | $14,272 | $373,900 | $115,000 | $258,900 |
| 2014 | $13,991 | $373,900 | $115,000 | $258,900 |
Source: Public Records
Map
Nearby Homes