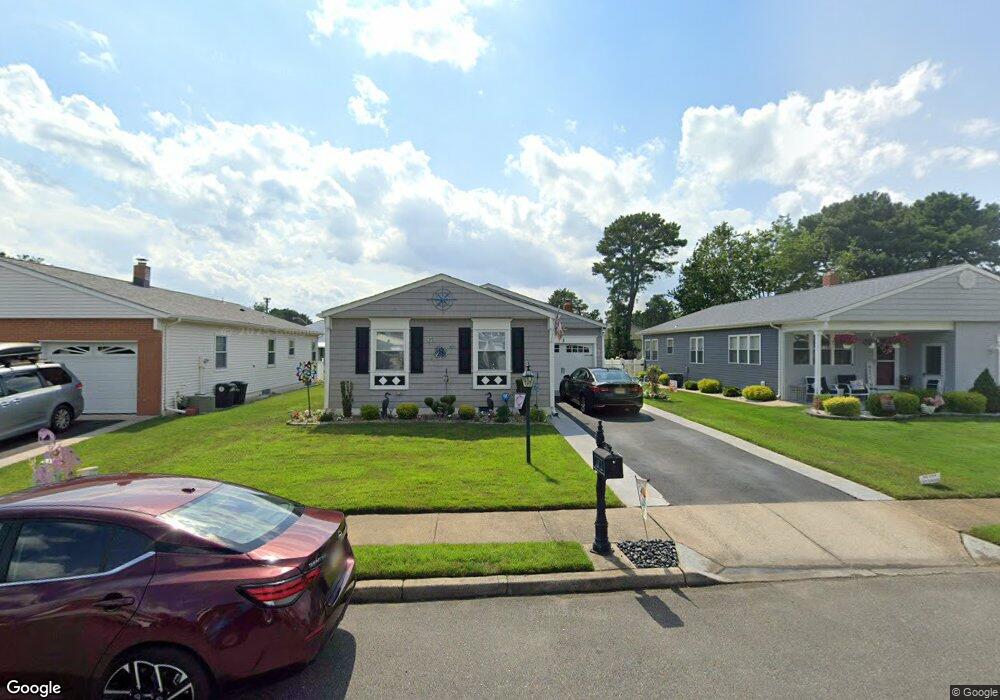
3 Calalou Ct Toms River, NJ 08757
Estimated Value: $374,647 - $425,000
2
Beds
2
Baths
1,364
Sq Ft
$293/Sq Ft
Est. Value
About This Home
This home is located at 3 Calalou Ct, Toms River, NJ 08757 and is currently estimated at $399,162, approximately $292 per square foot. 3 Calalou Ct is a home located in Ocean County with nearby schools including Central Regional Middle School, Central Regional High School, and St Joseph Grade School.
Ownership History
Date
Name
Owned For
Owner Type
Purchase Details
Closed on
Jul 17, 2023
Sold by
Odee Marilyn and Occhifinto Donna
Bought by
Odee Occhifinto Living Trust
Current Estimated Value
Purchase Details
Closed on
Sep 15, 2017
Sold by
Kau Lorraine
Bought by
Odee Marilyn and Occhifinto Donna
Home Financials for this Owner
Home Financials are based on the most recent Mortgage that was taken out on this home.
Original Mortgage
$194,000
Interest Rate
3.89%
Mortgage Type
New Conventional
Purchase Details
Closed on
Dec 15, 2016
Sold by
Kaplan Frances
Bought by
Kau Lorraine
Home Financials for this Owner
Home Financials are based on the most recent Mortgage that was taken out on this home.
Original Mortgage
$149,000
Interest Rate
4.08%
Mortgage Type
New Conventional
Purchase Details
Closed on
May 28, 2009
Sold by
Kaplan Frances and Gewanter Susan
Bought by
Kaplan Frances and Gewanter Susan
Purchase Details
Closed on
Aug 19, 2008
Sold by
Kaplan Frances
Bought by
Kaplan Frances and Gewanter Susan
Create a Home Valuation Report for This Property
The Home Valuation Report is an in-depth analysis detailing your home's value as well as a comparison with similar homes in the area
Home Values in the Area
Average Home Value in this Area
Purchase History
| Date | Buyer | Sale Price | Title Company |
|---|---|---|---|
| Odee Occhifinto Living Trust | -- | None Listed On Document | |
| Odee Marilyn | $242,500 | Counsellors Title | |
| Kau Lorraine | $120,000 | -- | |
| Kaplan Frances | -- | None Available | |
| Kaplan Frances | -- | None Available |
Source: Public Records
Mortgage History
| Date | Status | Borrower | Loan Amount |
|---|---|---|---|
| Previous Owner | Odee Marilyn | $194,000 | |
| Previous Owner | Kau Lorraine | $149,000 |
Source: Public Records
Tax History Compared to Growth
Tax History
| Year | Tax Paid | Tax Assessment Tax Assessment Total Assessment is a certain percentage of the fair market value that is determined by local assessors to be the total taxable value of land and additions on the property. | Land | Improvement |
|---|---|---|---|---|
| 2025 | $4,629 | $192,000 | $30,000 | $162,000 |
| 2024 | $4,204 | $192,000 | $30,000 | $162,000 |
| 2023 | $4,122 | $192,000 | $30,000 | $162,000 |
| 2022 | $4,372 | $192,000 | $30,000 | $162,000 |
| 2021 | $4,030 | $192,000 | $30,000 | $162,000 |
| 2020 | $4,280 | $192,000 | $30,000 | $162,000 |
| 2019 | $4,161 | $192,000 | $30,000 | $162,000 |
| 2018 | $2,735 | $126,600 | $30,000 | $96,600 |
| 2017 | $2,633 | $126,600 | $30,000 | $96,600 |
| 2016 | $2,119 | $126,600 | $30,000 | $96,600 |
| 2015 | $2,047 | $126,600 | $30,000 | $96,600 |
| 2014 | $1,975 | $126,600 | $30,000 | $96,600 |
Source: Public Records
Map
Nearby Homes
- 47 Selkirk Ave
- 24 Selkirk Ave
- 201 Freeport Blvd
- 11 Selkirk Ave
- 82 Virgin Islands Dr
- 18 Olstins Ct
- 15 Roxton Place
- 248 Orlando Blvd
- 8 Panama Ct
- 132 Freeport Blvd
- 2 Lumsden St
- 34 San Carlos St
- 62 Virgin Islands Dr
- 118 Orlando Blvd
- 25 San Carlos St
- 143 Davenport Rd
- 4 Portsmouth Dr
- 94 Orlando Blvd
- 77 Orlando Blvd
- 14 Portsmouth Dr