Estimated Value: $119,580 - $176,000
1
Bed
1
Bath
640
Sq Ft
$234/Sq Ft
Est. Value
About This Home
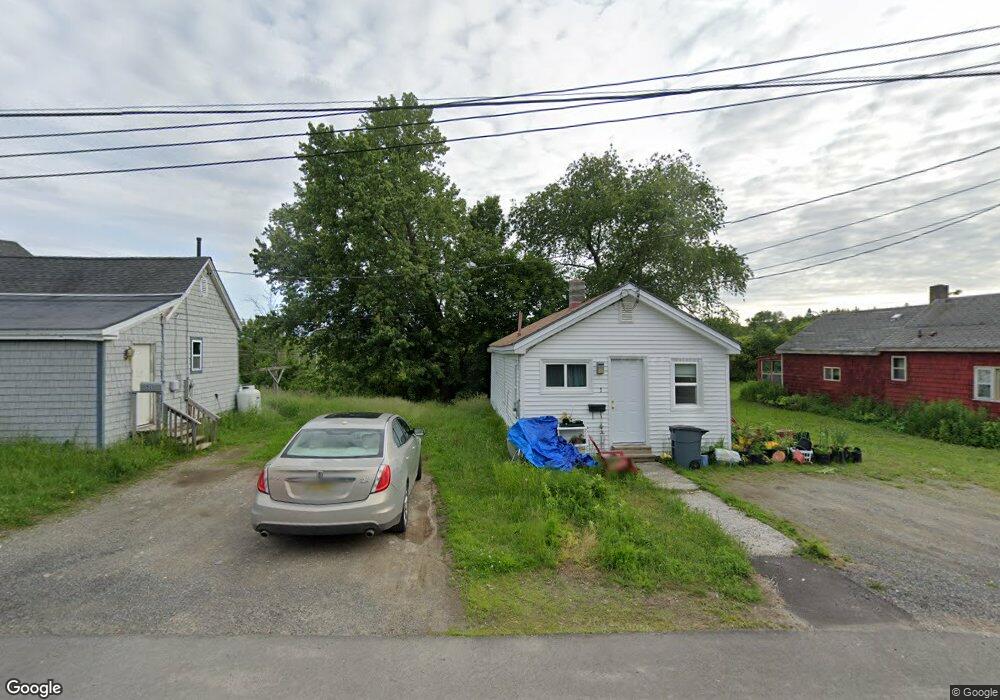
This home is located at 3 Cedar St, Orono, ME 04473 and is currently estimated at $149,645, approximately $233 per square foot. 3 Cedar St is a home with nearby schools including Orono Middle School and Orono High School.
Ownership History
Date
Name
Owned For
Owner Type
Purchase Details
Closed on
Jan 8, 2018
Sold by
Duane L Jellison
Bought by
Zuhike James
Current Estimated Value
Home Financials for this Owner
Home Financials are based on the most recent Mortgage that was taken out on this home.
Original Mortgage
$125,000
Outstanding Balance
$105,512
Interest Rate
3.95%
Estimated Equity
$44,133
Purchase Details
Closed on
Apr 5, 2013
Sold by
Edes Katherine C
Bought by
Lusaka Props Llc
Purchase Details
Closed on
Sep 1, 2010
Sold by
Hile Renae L Est
Bought by
Edes Katherine C
Create a Home Valuation Report for This Property
The Home Valuation Report is an in-depth analysis detailing your home's value as well as a comparison with similar homes in the area
Home Values in the Area
Average Home Value in this Area
Purchase History
| Date | Buyer | Sale Price | Title Company |
|---|---|---|---|
| Zuhike James | -- | -- | |
| Lusaka Props Llc | -- | -- | |
| Edes Katherine C | -- | -- |
Source: Public Records
Mortgage History
| Date | Status | Borrower | Loan Amount |
|---|---|---|---|
| Open | Edes Katherine C | $125,000 | |
| Closed | Edes Katherine C | -- |
Source: Public Records
Tax History
| Year | Tax Paid | Tax Assessment Tax Assessment Total Assessment is a certain percentage of the fair market value that is determined by local assessors to be the total taxable value of land and additions on the property. | Land | Improvement |
|---|---|---|---|---|
| 2024 | $1,674 | $78,400 | $20,000 | $58,400 |
| 2023 | $1,668 | $71,300 | $18,200 | $53,100 |
| 2022 | $1,697 | $71,300 | $18,200 | $53,100 |
| 2021 | $1,693 | $71,300 | $18,200 | $53,100 |
| 2020 | $1,427 | $50,800 | $24,500 | $26,300 |
| 2019 | $1,344 | $50,800 | $24,500 | $26,300 |
| 2018 | $1,372 | $50,800 | $24,500 | $26,300 |
| 2017 | $1,321 | $50,800 | $24,500 | $26,300 |
| 2016 | $1,262 | $50,800 | $24,500 | $26,300 |
| 2015 | $1,240 | $50,800 | $24,500 | $26,300 |
| 2014 | $1,212 | $50,800 | $24,500 | $26,300 |
| 2013 | $1,179 | $50,800 | $24,500 | $26,300 |
Source: Public Records
Map
Nearby Homes
- 25 Margin St
- 7 Forest Ave
- 5 Shore Dr Unit 10
- 103 Margin St
- 64 Penobscot St
- 71 Penney Ln
- Lot 4 Main St
- 115 Penney Ln
- 117 & 115 Park St
- 148 College Ave
- 2 Forest Hill Terrace
- 8 Sylvan Rd
- 22 Franklin St
- 2 S Spring St
- 19 Crestview Dr
- 1024 Stillwater Ave
- Lot 14 Grant Rd
- Map17Lot53 Grant Rd
- Lot 12 Grant Rd
- 916 Main St
Your Personal Tour Guide
Ask me questions while you tour the home.