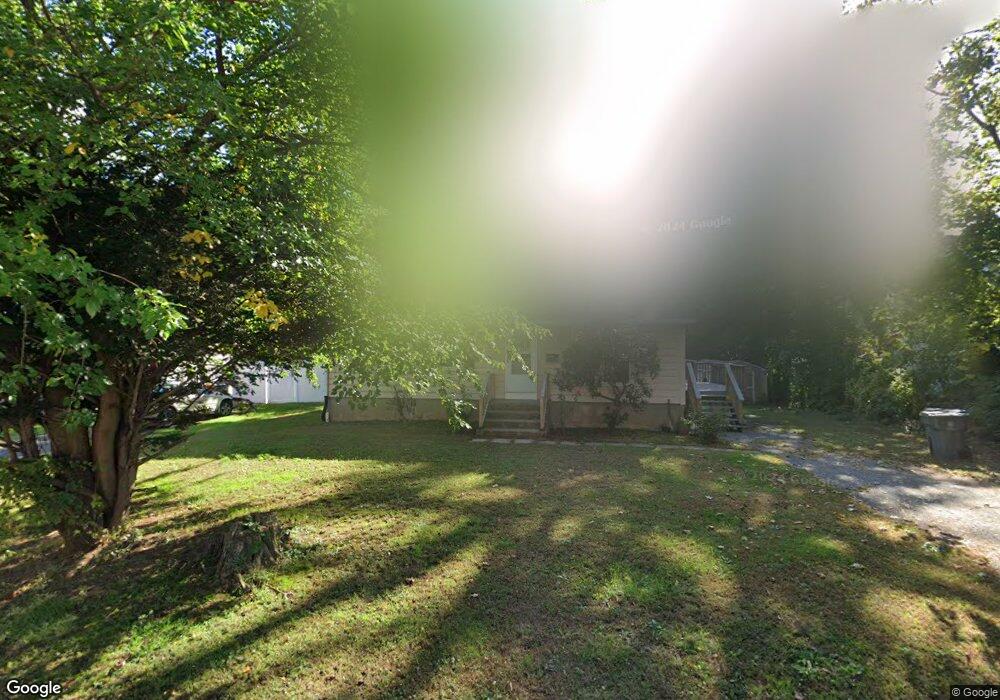
3 Cianci Ave Plainville, CT 06062
Estimated Value: $237,000 - $293,905
3
Beds
1
Bath
912
Sq Ft
$275/Sq Ft
Est. Value
About This Home
This home is located at 3 Cianci Ave, Plainville, CT 06062 and is currently estimated at $251,226, approximately $275 per square foot. 3 Cianci Ave is a home located in Hartford County with nearby schools including Middle School Of Plainville, Plainville High School, and Great Beginnings.
Ownership History
Date
Name
Owned For
Owner Type
Purchase Details
Closed on
Apr 30, 2025
Sold by
Ssg Real Estate Llc
Bought by
Ho Hien S
Current Estimated Value
Home Financials for this Owner
Home Financials are based on the most recent Mortgage that was taken out on this home.
Original Mortgage
$211,500
Outstanding Balance
$210,754
Interest Rate
6.67%
Mortgage Type
Purchase Money Mortgage
Estimated Equity
$40,472
Purchase Details
Closed on
Feb 21, 2020
Sold by
Adamaitis Tina
Bought by
Ssg Real Estate Llc
Purchase Details
Closed on
Jun 12, 2014
Sold by
Adamaitis Frank T
Bought by
Ouellette Tina M
Purchase Details
Closed on
Nov 20, 1995
Sold by
Akins Lee H and Akins Lauren L
Bought by
Ouellette Tina M
Home Financials for this Owner
Home Financials are based on the most recent Mortgage that was taken out on this home.
Original Mortgage
$88,800
Interest Rate
7.53%
Mortgage Type
Unknown
Create a Home Valuation Report for This Property
The Home Valuation Report is an in-depth analysis detailing your home's value as well as a comparison with similar homes in the area
Home Values in the Area
Average Home Value in this Area
Purchase History
| Date | Buyer | Sale Price | Title Company |
|---|---|---|---|
| Ho Hien S | $235,000 | None Available | |
| Ho Hien S | $235,000 | None Available | |
| Ssg Real Estate Llc | -- | None Available | |
| Ssg Real Estate Llc | -- | None Available | |
| Ouellette Tina M | -- | -- | |
| Ouellette Tina M | -- | -- | |
| Ouellette Tina M | $89,900 | -- | |
| Ouellette Tina M | $89,900 | -- |
Source: Public Records
Mortgage History
| Date | Status | Borrower | Loan Amount |
|---|---|---|---|
| Open | Ho Hien S | $211,500 | |
| Closed | Ho Hien S | $211,500 | |
| Previous Owner | Ouellette Tina M | $115,000 | |
| Previous Owner | Ouellette Tina M | $88,800 |
Source: Public Records
Tax History Compared to Growth
Tax History
| Year | Tax Paid | Tax Assessment Tax Assessment Total Assessment is a certain percentage of the fair market value that is determined by local assessors to be the total taxable value of land and additions on the property. | Land | Improvement |
|---|---|---|---|---|
| 2025 | $4,079 | $118,720 | $54,040 | $64,680 |
| 2024 | $3,875 | $118,720 | $54,040 | $64,680 |
| 2023 | $3,730 | $118,720 | $54,040 | $64,680 |
| 2022 | $3,638 | $118,720 | $54,040 | $64,680 |
| 2021 | $3,365 | $97,370 | $51,030 | $46,340 |
| 2020 | $3,371 | $97,370 | $51,030 | $46,340 |
| 2019 | $3,371 | $97,370 | $51,030 | $46,340 |
| 2018 | $3,295 | $97,370 | $51,030 | $46,340 |
| 2017 | $3,182 | $97,370 | $51,030 | $46,340 |
| 2016 | $3,048 | $95,270 | $47,530 | $47,740 |
| 2015 | $3,032 | $95,270 | $47,530 | $47,740 |
| 2014 | $3,398 | $108,290 | $44,030 | $64,260 |
Source: Public Records
Map
Nearby Homes
- 452 East St
- 11 Oakwood Cir
- 9 Pinecrest Dr
- 4 Testa Dr
- 180 S Washington St Unit 12
- 59 Minthal Dr
- 18 Homestead Ave
- 138 Butler Ave
- 1 Brookside Dr
- 110 Rethal St
- 147 Rethal St
- 16 Brookside Dr
- 117 Hollyberry Ln
- 189 Redstone Hill Rd Unit 7
- 27 Brookside Dr
- 4 Maple Rock Rd
- 26 Skyline Dr
- 34 Skyline Dr
- 15 Sunrise Terrace
- 21 Julia Rd
- 5 Cianci Ave
- 2 Cianci Ave Unit 3
- 2 Cianci Ave Unit 4
- 2 Cianci Ave
- 7 Cianci Ave
- 4 Cianci Ave Unit 5
- 4 Cianci Ave Unit 3
- 4 Cianci Ave Unit 6
- 4 Cianci Ave Unit 13
- 4 Cianci Ave Unit 1
- 452 East St Unit B2
- 452 East St Unit 2 AR
- 452 East St Unit 2AF
- 452 East St Unit 2BR
- 452 East St Unit 1AF
- 452 East St Unit Rear 2 BR
- 452 East St Unit Rear 2 AR
- 452 East St Unit Rear 1
- 452 East St Unit 2-BF
- 444 East St