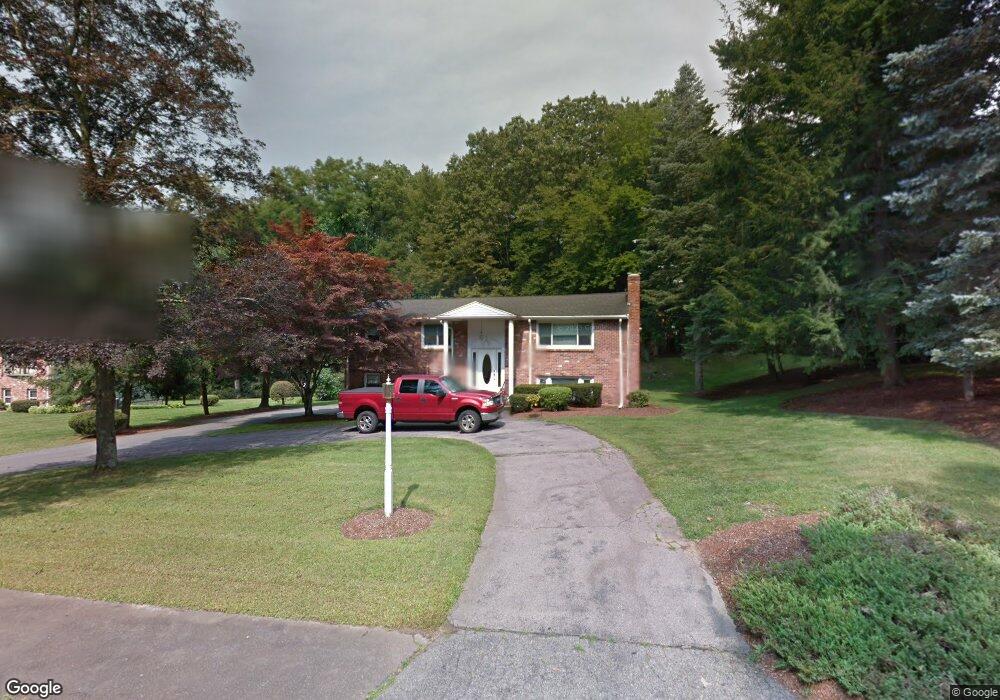
3 Clarkson Dr Walpole, MA 02081
Estimated Value: $614,000 - $669,000
3
Beds
2
Baths
1,415
Sq Ft
$459/Sq Ft
Est. Value
About This Home
This home is located at 3 Clarkson Dr, Walpole, MA 02081 and is currently estimated at $649,287, approximately $458 per square foot. 3 Clarkson Dr is a home located in Norfolk County with nearby schools including Elm Street School, Eleanor N. Johnson Middle School, and Walpole High School.
Ownership History
Date
Name
Owned For
Owner Type
Purchase Details
Closed on
Jun 13, 2003
Sold by
Kenney Edwin M
Bought by
Foynes John H and Foynes Shana L
Current Estimated Value
Home Financials for this Owner
Home Financials are based on the most recent Mortgage that was taken out on this home.
Original Mortgage
$322,500
Outstanding Balance
$141,168
Interest Rate
5.77%
Mortgage Type
Purchase Money Mortgage
Estimated Equity
$508,119
Create a Home Valuation Report for This Property
The Home Valuation Report is an in-depth analysis detailing your home's value as well as a comparison with similar homes in the area
Home Values in the Area
Average Home Value in this Area
Purchase History
| Date | Buyer | Sale Price | Title Company |
|---|---|---|---|
| Foynes John H | $348,000 | -- |
Source: Public Records
Mortgage History
| Date | Status | Borrower | Loan Amount |
|---|---|---|---|
| Open | Foynes John H | $322,500 |
Source: Public Records
Tax History Compared to Growth
Tax History
| Year | Tax Paid | Tax Assessment Tax Assessment Total Assessment is a certain percentage of the fair market value that is determined by local assessors to be the total taxable value of land and additions on the property. | Land | Improvement |
|---|---|---|---|---|
| 2025 | $7,350 | $572,900 | $339,700 | $233,200 |
| 2024 | $7,192 | $544,000 | $326,500 | $217,500 |
| 2023 | $6,859 | $493,800 | $284,000 | $209,800 |
| 2022 | $6,482 | $448,300 | $263,000 | $185,300 |
| 2021 | $6,239 | $420,400 | $248,100 | $172,300 |
| 2020 | $6,207 | $414,100 | $234,000 | $180,100 |
| 2019 | $5,974 | $395,600 | $225,100 | $170,500 |
| 2018 | $5,632 | $368,800 | $217,200 | $151,600 |
| 2017 | $5,444 | $355,100 | $208,900 | $146,200 |
| 2016 | $5,298 | $340,500 | $201,000 | $139,500 |
| 2015 | $4,978 | $317,100 | $183,200 | $133,900 |
| 2014 | $4,774 | $302,900 | $183,200 | $119,700 |
Source: Public Records
Map
Nearby Homes
- 1648 Main St
- 1391 Main St Unit 304
- 1391 Main St Unit 208
- 1391 Main St Unit 305
- 1391 Main St Unit 308
- 13 Sandtrap Cir Unit 14
- 11 Sandtrap Cir Unit 15
- 20 Sandtrap Cir Unit 4
- 18 Sandtrap Cir Unit 3
- 17 Sandtrap Cir Unit 12
- 15 Sandtrap Cir Unit 13
- 43 Chandler Ave
- 10 Sandtrap Cir Unit 2
- 31 Sandtrap Cir Unit 5
- 14 Tiger Terrace Unit 29
- 127 Clear Pond Dr
- 137 Clear Pond Dr
- 66 Oak St
- 16 Magpie Cir Unit 16
- 8 Autumn Ln
- 5 Clarkson Dr
- 1 Clarkson Dr
- 4 Clarkson Dr
- 2 Clarkson Dr
- 7 Clarkson Dr
- 6 Clarkson Dr
- 8 Clarkson Dr
- 9 Clarkson Dr
- 1646 Main St
- 3 Hitching Post Dr
- 1644 Main St
- 7 Hitching Post Dr
- 10 Clarkson Dr
- 1642 Main St
- 2 Hitching Post Dr
- 11 Hitching Post Dr
- 11 Clarkson Dr
- 1620 Main St
- 4 Hitching Post Dr
- 12 Clarkson Dr