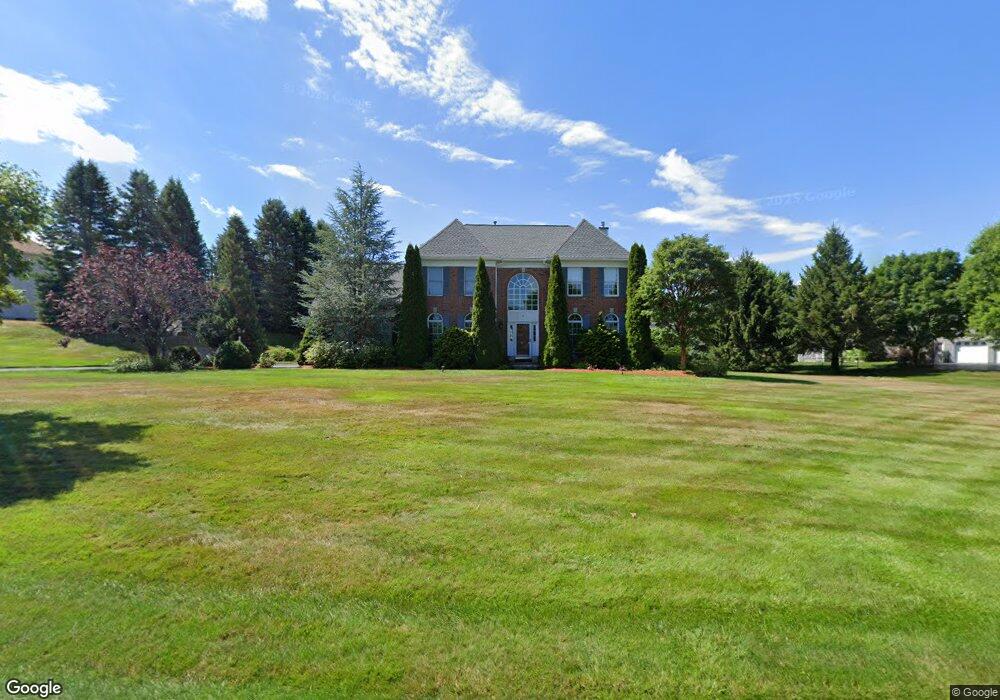
3 Cook St Westborough, MA 01581
Estimated Value: $1,121,453 - $1,301,000
4
Beds
4
Baths
3,312
Sq Ft
$362/Sq Ft
Est. Value
About This Home
This home is located at 3 Cook St, Westborough, MA 01581 and is currently estimated at $1,198,484, approximately $361 per square foot. 3 Cook St is a home located in Worcester County with nearby schools including Westborough High School, Ebridge Montessori School, and Westboro Knowledge Beginnings.
Ownership History
Date
Name
Owned For
Owner Type
Purchase Details
Closed on
Mar 8, 2022
Sold by
Leef Phillip H
Bought by
Phillip Harris Leef T
Current Estimated Value
Purchase Details
Closed on
Mar 10, 2014
Sold by
Covino John and Covino Paula
Bought by
Covino Paula
Purchase Details
Closed on
Jul 15, 1996
Sold by
Valley View Est Lp
Bought by
Covino John M and Covino Paula
Create a Home Valuation Report for This Property
The Home Valuation Report is an in-depth analysis detailing your home's value as well as a comparison with similar homes in the area
Home Values in the Area
Average Home Value in this Area
Purchase History
| Date | Buyer | Sale Price | Title Company |
|---|---|---|---|
| Phillip Harris Leef T | -- | None Available | |
| Covino Paula | -- | -- | |
| Covino John M | $314,721 | -- |
Source: Public Records
Mortgage History
| Date | Status | Borrower | Loan Amount |
|---|---|---|---|
| Previous Owner | Covino John M | $189,550 | |
| Previous Owner | Covino John M | $177,300 | |
| Previous Owner | Covino John M | $25,000 | |
| Previous Owner | Covino John M | $202,000 |
Source: Public Records
Tax History
| Year | Tax Paid | Tax Assessment Tax Assessment Total Assessment is a certain percentage of the fair market value that is determined by local assessors to be the total taxable value of land and additions on the property. | Land | Improvement |
|---|---|---|---|---|
| 2025 | $15,844 | $972,600 | $374,500 | $598,100 |
| 2024 | $15,788 | $962,100 | $350,200 | $611,900 |
| 2023 | $15,122 | $898,000 | $333,300 | $564,700 |
| 2022 | $14,141 | $764,800 | $269,200 | $495,600 |
| 2021 | $13,870 | $748,100 | $252,500 | $495,600 |
| 2020 | $13,751 | $750,600 | $267,300 | $483,300 |
| 2019 | $13,403 | $731,200 | $263,000 | $468,200 |
| 2018 | $12,621 | $683,700 | $263,000 | $420,700 |
| 2017 | $12,003 | $674,300 | $263,000 | $411,300 |
| 2016 | $12,055 | $678,400 | $263,000 | $415,400 |
| 2015 | $11,173 | $601,000 | $235,700 | $365,300 |
Source: Public Records
Map
Nearby Homes
- 14 Baldwin Ct Unit 14
- 11 Quick Farm Rd
- 4 Quick Farm Rd
- 51 Lackey St
- 215 North St
- 46 Lackey St
- 60 Belknap St
- 48 Lackey St
- 248 W Main St
- 29 Kay St
- 26 Mount Pleasant St
- 192 W Main St
- 22 Capt Samuel Forbush Rd
- LL43 Libbey Ln
- LL39 Libbey Ln
- 7 Grindstone Ct
- 6 Piccadilly Way
- 186 Spring St
- 55 Nourse St
- LC7 Liberty Cir
Your Personal Tour Guide
Ask me questions while you tour the home.