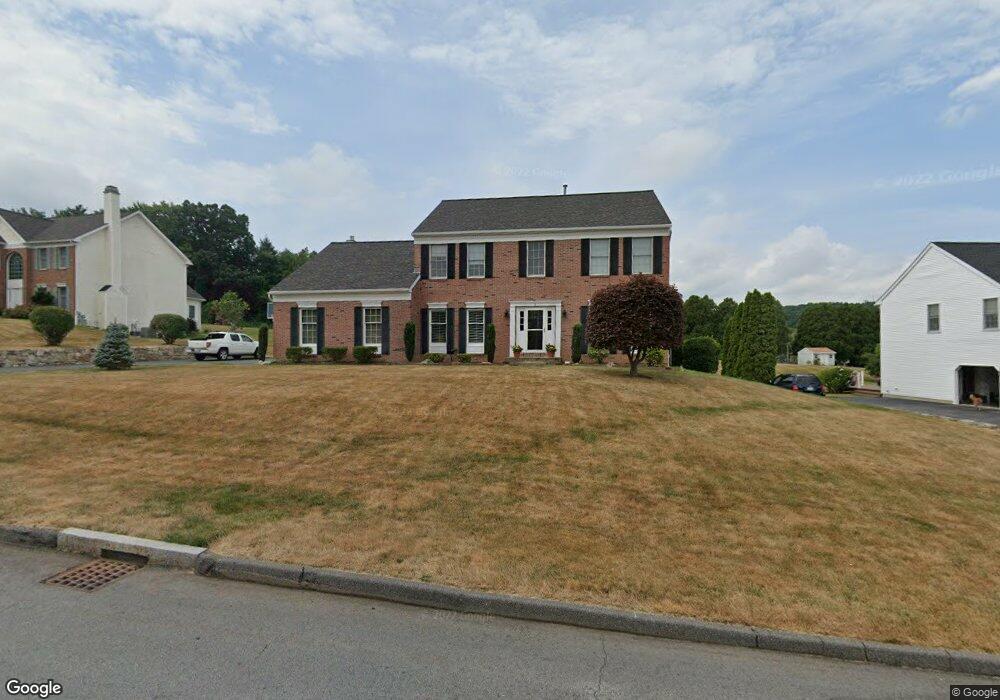
9 Cook St Westborough, MA 01581
Estimated Value: $1,006,323 - $1,148,000
4
Beds
3
Baths
2,559
Sq Ft
$425/Sq Ft
Est. Value
About This Home
This home is located at 9 Cook St, Westborough, MA 01581 and is currently estimated at $1,088,774, approximately $425 per square foot. 9 Cook St is a home located in Worcester County with nearby schools including Westborough High School, Ebridge Montessori School, and Westboro Knowledge Beginnings.
Ownership History
Date
Name
Owned For
Owner Type
Purchase Details
Closed on
Sep 15, 1995
Sold by
Valley View Est Lp
Bought by
Lamountain John S and Lamountain Linette
Current Estimated Value
Create a Home Valuation Report for This Property
The Home Valuation Report is an in-depth analysis detailing your home's value as well as a comparison with similar homes in the area
Home Values in the Area
Average Home Value in this Area
Purchase History
We collect this data history from publicly available records. To have your information removed, we recommend requesting removal directly through your county’s website.
| Date | Buyer | Sale Price | Title Company |
|---|---|---|---|
| Lamountain John S | $332,132 | -- |
Source: Public Records
Mortgage History
We collect this data history from publicly available records. To have your information removed, we recommend requesting removal directly through your county’s website.
| Date | Status | Borrower | Loan Amount |
|---|---|---|---|
| Open | Lamountain John S | $125,000 | |
| Closed | Lamountain John S | $25,000 | |
| Closed | Lamountain John S | $75,000 | |
| Closed | Lamountain John S | $150,000 |
Source: Public Records
Tax History
| Year | Tax Paid | Tax Assessment Tax Assessment Total Assessment is a certain percentage of the fair market value that is determined by local assessors to be the total taxable value of land and additions on the property. | Land | Improvement |
|---|---|---|---|---|
| 2025 | $14,296 | $877,600 | $369,500 | $508,100 |
| 2024 | $13,537 | $824,900 | $345,300 | $479,600 |
| 2023 | $13,036 | $774,100 | $328,600 | $445,500 |
| 2022 | $12,118 | $655,400 | $265,700 | $389,700 |
| 2021 | $11,841 | $638,700 | $249,000 | $389,700 |
| 2020 | $11,785 | $643,300 | $263,500 | $379,800 |
| 2019 | $11,495 | $627,100 | $259,400 | $367,700 |
| 2018 | $10,906 | $590,800 | $259,400 | $331,400 |
| 2017 | $10,516 | $590,800 | $259,400 | $331,400 |
| 2016 | $10,557 | $594,100 | $259,400 | $334,700 |
| 2015 | $10,135 | $545,200 | $232,400 | $312,800 |
Source: Public Records
Map
Nearby Homes
- 9 Baldwin Ct
- 3 Olde Meetinghouse Rd
- 11 Quick Farm Rd
- 9 Olde Meetinghouse Rd
- 19 Imperial Ct
- 128 Upton Rd
- 51 Lackey St
- 215 North St
- 46 Lackey St
- 48 Lackey St
- 27 Spring Rd
- 44 Old Colony Dr
- 12 Arrowhead Ln
- 186 Spring St
- 7 Grindstone Ct
- 14 Mctaggart St
- LL45 Libbey Ln
- LL39 Libbey Ln
- 8 Piccadilly Way
- 9 Catie Dr
Your Personal Tour Guide
Ask me questions while you tour the home.