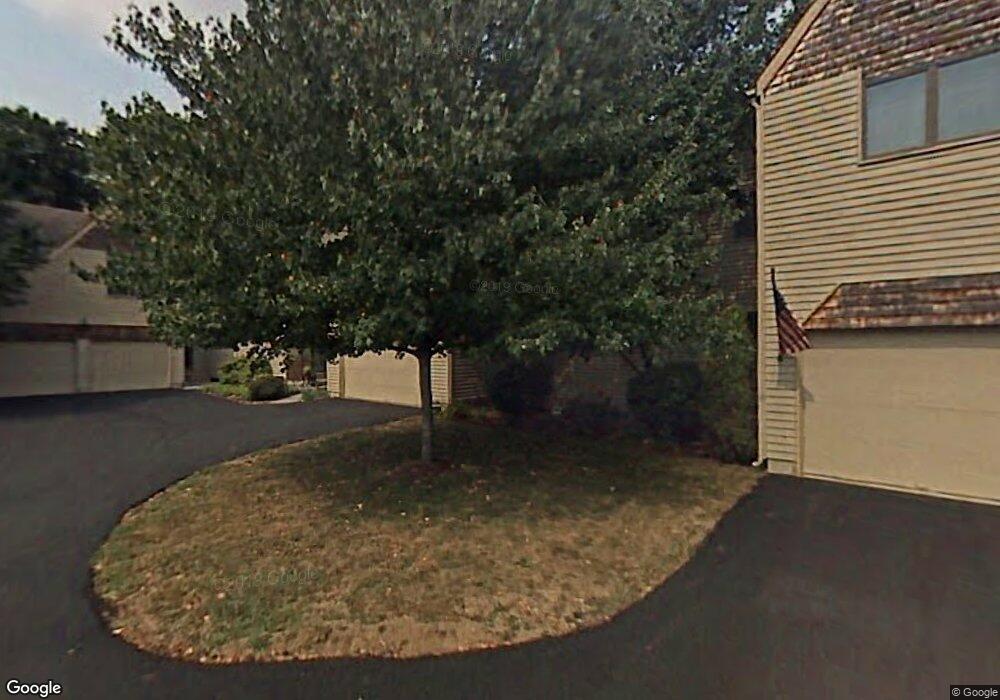
3 Cottonwood Ct Granby, CT 06035
Estimated Value: $354,341 - $379,000
2
Beds
3
Baths
1,683
Sq Ft
$218/Sq Ft
Est. Value
About This Home
This home is located at 3 Cottonwood Ct, Granby, CT 06035 and is currently estimated at $366,585, approximately $217 per square foot. 3 Cottonwood Ct is a home located in Hartford County with nearby schools including Kelly Lane Primary School, Granby Memorial Middle School, and Granby Memorial High School.
Ownership History
Date
Name
Owned For
Owner Type
Purchase Details
Closed on
Dec 2, 2014
Sold by
Barrett Kenneth A
Bought by
Hug Amanda R
Current Estimated Value
Home Financials for this Owner
Home Financials are based on the most recent Mortgage that was taken out on this home.
Original Mortgage
$160,000
Outstanding Balance
$44,578
Interest Rate
4%
Mortgage Type
New Conventional
Estimated Equity
$322,007
Purchase Details
Closed on
Oct 11, 2002
Sold by
Rick Douglas
Bought by
Barrett Kenneth and Barrett Muriel
Purchase Details
Closed on
Aug 2, 2000
Sold by
Batchelder Eric
Bought by
Rick Douglas
Home Financials for this Owner
Home Financials are based on the most recent Mortgage that was taken out on this home.
Original Mortgage
$135,800
Interest Rate
8.1%
Purchase Details
Closed on
Jul 1, 1997
Sold by
Northeast Dev Assoc
Bought by
Batchelder Eric
Create a Home Valuation Report for This Property
The Home Valuation Report is an in-depth analysis detailing your home's value as well as a comparison with similar homes in the area
Home Values in the Area
Average Home Value in this Area
Purchase History
| Date | Buyer | Sale Price | Title Company |
|---|---|---|---|
| Hug Amanda R | $201,000 | -- | |
| Hug Amanda R | $201,000 | -- | |
| Barrett Kenneth | $229,900 | -- | |
| Barrett Kenneth | $229,900 | -- | |
| Rick Douglas | $169,700 | -- | |
| Rick Douglas | $169,700 | -- | |
| Batchelder Eric | $142,000 | -- | |
| Batchelder Eric | $142,000 | -- |
Source: Public Records
Mortgage History
| Date | Status | Borrower | Loan Amount |
|---|---|---|---|
| Open | Batchelder Eric | $160,000 | |
| Closed | Batchelder Eric | $160,000 | |
| Previous Owner | Batchelder Eric | $135,800 |
Source: Public Records
Tax History Compared to Growth
Tax History
| Year | Tax Paid | Tax Assessment Tax Assessment Total Assessment is a certain percentage of the fair market value that is determined by local assessors to be the total taxable value of land and additions on the property. | Land | Improvement |
|---|---|---|---|---|
| 2025 | $6,327 | $184,940 | $0 | $184,940 |
| 2024 | $6,127 | $184,940 | $0 | $184,940 |
| 2023 | $5,898 | $184,940 | $0 | $184,940 |
| 2022 | $5,712 | $142,870 | $0 | $142,870 |
| 2021 | $5,659 | $142,870 | $0 | $142,870 |
| 2020 | $5,659 | $142,870 | $0 | $142,870 |
| 2019 | $5,659 | $142,870 | $0 | $142,870 |
| 2018 | $5,528 | $142,870 | $0 | $142,870 |
| 2017 | $4,919 | $129,640 | $0 | $129,640 |
| 2016 | $4,789 | $129,640 | $0 | $129,640 |
| 2015 | $4,696 | $129,640 | $0 | $129,640 |
| 2014 | $4,605 | $129,640 | $0 | $129,640 |
Source: Public Records
Map
Nearby Homes
- 238 Salmon Brook St
- 24 Rushford Meade Unit 24
- 17 Elizabeth St
- 52 North Rd
- 106 W Granby Rd
- 47 Salmon Brook St
- 125 N Granby Rd
- 5 Washington Dr
- 414 Salmon Brook St
- 14 Brettonwood Dr
- 277 N Granby Rd
- 4 Stonewall Dr
- 7R Stonewall Dr
- 192 Day St
- 44 Strong Rd
- 21 Newgate Rd
- 91 Turkey Hills Rd
- 22 Old Hartford Ave Unit 22
- 2 Quail Dr Unit 2
- 14 Teal Cir Unit 14
- 3 Cottonwood Ct Unit 3
- 5 Cottonwood Ct
- 1 Cottonwood Ct
- 7 Cottonwood Ct
- 4 Dogwood Ct
- 6 Cottonwood Ct
- 6 Cottonwood Ct Unit 6
- 2 Cottonwood Ct
- 6 Dogwood Ct
- 1 Boxwood Ct
- 4 Cottonwood Ct
- 4 Cottonwood Ct Unit 4
- 3 Boxwood Ct
- 3 Boxwood Ct Unit 3
- 8 Dogwood Ct
- 1 Dogwood Ct
- 1 Dogwood Ct Unit 1
- 5 Boxwood Ct
- 5 Boxwood Ct Unit 5
- 9 Dogwood Ct