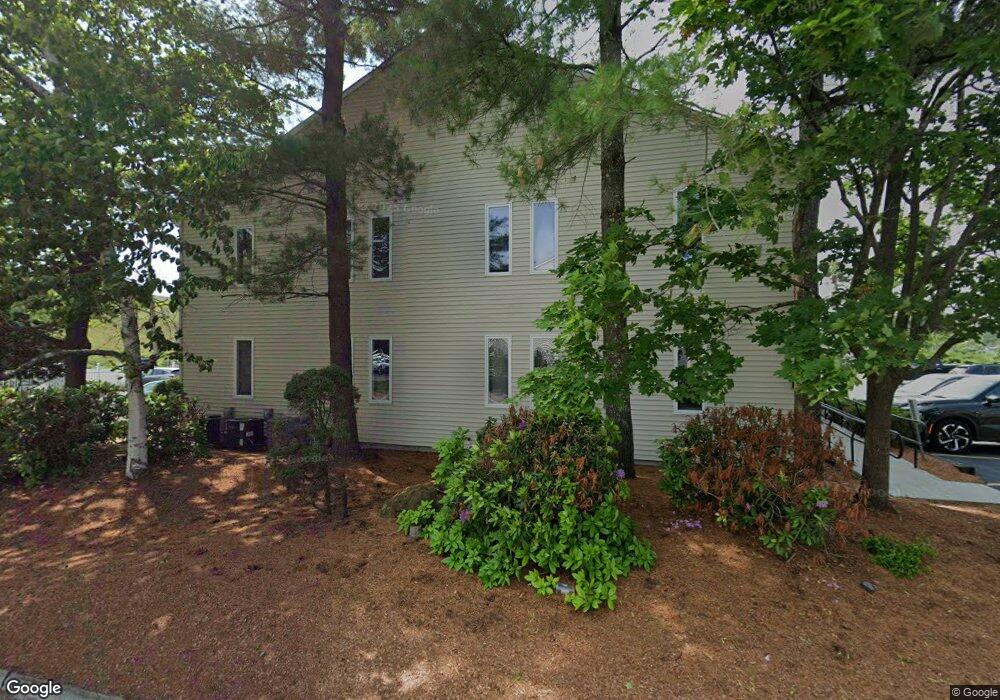
3 Courthouse Ln Unit 8 Chelmsford, MA 01824
North Chelmsford NeighborhoodEstimated Value: $185,416
--
Bed
4
Baths
1,250
Sq Ft
$148/Sq Ft
Est. Value
About This Home
This home is located at 3 Courthouse Ln Unit 8, Chelmsford, MA 01824 and is currently estimated at $185,416, approximately $148 per square foot. 3 Courthouse Ln Unit 8 is a home located in Middlesex County with nearby schools including Center Elementary School, McCarthy Middle School, and Chelmsford High School.
Ownership History
Date
Name
Owned For
Owner Type
Purchase Details
Closed on
Dec 13, 2022
Sold by
Arpin Intl Group Inc
Bought by
Kbf Digital Ent Corp
Current Estimated Value
Home Financials for this Owner
Home Financials are based on the most recent Mortgage that was taken out on this home.
Original Mortgage
$135,000
Outstanding Balance
$130,949
Interest Rate
6.95%
Mortgage Type
Purchase Money Mortgage
Estimated Equity
$54,467
Purchase Details
Closed on
Jun 1, 2004
Sold by
Bovill John R
Bought by
Arpin Intl Group Inc
Home Financials for this Owner
Home Financials are based on the most recent Mortgage that was taken out on this home.
Original Mortgage
$45,000
Interest Rate
5.88%
Mortgage Type
Commercial
Purchase Details
Closed on
Jul 17, 1997
Sold by
Fdic
Bought by
Jda Associates Inc
Home Financials for this Owner
Home Financials are based on the most recent Mortgage that was taken out on this home.
Original Mortgage
$24,750
Interest Rate
7.79%
Mortgage Type
Commercial
Create a Home Valuation Report for This Property
The Home Valuation Report is an in-depth analysis detailing your home's value as well as a comparison with similar homes in the area
Home Values in the Area
Average Home Value in this Area
Purchase History
| Date | Buyer | Sale Price | Title Company |
|---|---|---|---|
| Kbf Digital Ent Corp | $150,000 | None Available | |
| Arpin Intl Group Inc | $165,000 | -- | |
| Jda Associates Inc | $33,000 | -- |
Source: Public Records
Mortgage History
| Date | Status | Borrower | Loan Amount |
|---|---|---|---|
| Open | Kbf Digital Ent Corp | $135,000 | |
| Previous Owner | Arpin Intl Group Inc | $45,000 | |
| Previous Owner | Jda Associates Inc | $24,750 |
Source: Public Records
Tax History Compared to Growth
Tax History
| Year | Tax Paid | Tax Assessment Tax Assessment Total Assessment is a certain percentage of the fair market value that is determined by local assessors to be the total taxable value of land and additions on the property. | Land | Improvement |
|---|---|---|---|---|
| 2025 | $2,490 | $147,100 | $0 | $147,100 |
| 2024 | $2,483 | $144,200 | $0 | $144,200 |
| 2023 | $2,489 | $137,000 | $0 | $137,000 |
| 2022 | $2,437 | $122,500 | $0 | $122,500 |
| 2021 | $2,399 | $118,200 | $0 | $118,200 |
| 2020 | $2,569 | $121,300 | $0 | $121,300 |
| 2019 | $2,661 | $119,800 | $0 | $119,800 |
| 2018 | $1,992 | $110,900 | $0 | $110,900 |
| 2017 | $2,120 | $118,300 | $0 | $118,300 |
| 2016 | $2,227 | $123,500 | $0 | $123,500 |
| 2015 | $2,192 | $117,200 | $0 | $117,200 |
| 2014 | $2,224 | $117,200 | $0 | $117,200 |
Source: Public Records
Map
Nearby Homes
- 255 North Rd Unit 154
- 255 North Rd Unit 144
- 255 North Rd Unit 207
- 28 Rainbow Ave
- 770 Princeton Blvd
- 90 Corey St
- 620 Princeton Blvd Unit 13
- 106 Stedman St
- 105 Lauriat St
- 24 Brouilette St Unit A
- 4 Tamarack St
- 1821 Middlesex St Unit 10
- 1975 Middlesex St Unit 2
- 1975 Middlesex St Unit 51
- 2 Walter G Wiede St Unit 7
- 96 Richardson Rd Unit A22
- 40 Grandview Rd
- 61 Florence Ave
- 9 Hatikva Way
- 96 Princeton St Unit 2
- 3 Courthouse Ln Unit 3
- 3 Courthouse Ln Unit 10
- 3 Courthouse Ln Unit 5
- 3 Courthouse Ln Unit 9-10
- 3 Courthouse Ln Unit 9
- 3 Courthouse Ln Unit 1
- 3 Courthouse Ln Unit 11
- 3 Courthouse Ln
- 3 Courthouse Ln Unit 4
- 1 Courthouse Ln Unit 5
- 1 Courthouse Ln Unit 7
- 1 Courthouse Ln Unit 6 & 8
- 1 Courthouse Ln Unit 8
- 1 Courthouse Ln Unit 6
- 1 Courthouse Ln Unit 9-11
- 1 Courthouse Ln Unit 13 & 15
- 1 Courthouse Ln Unit 2
- 1 Courthouse Ln
- 1 Courthouse Ln Unit 15
- 5 Courthouse Ln Unit 2