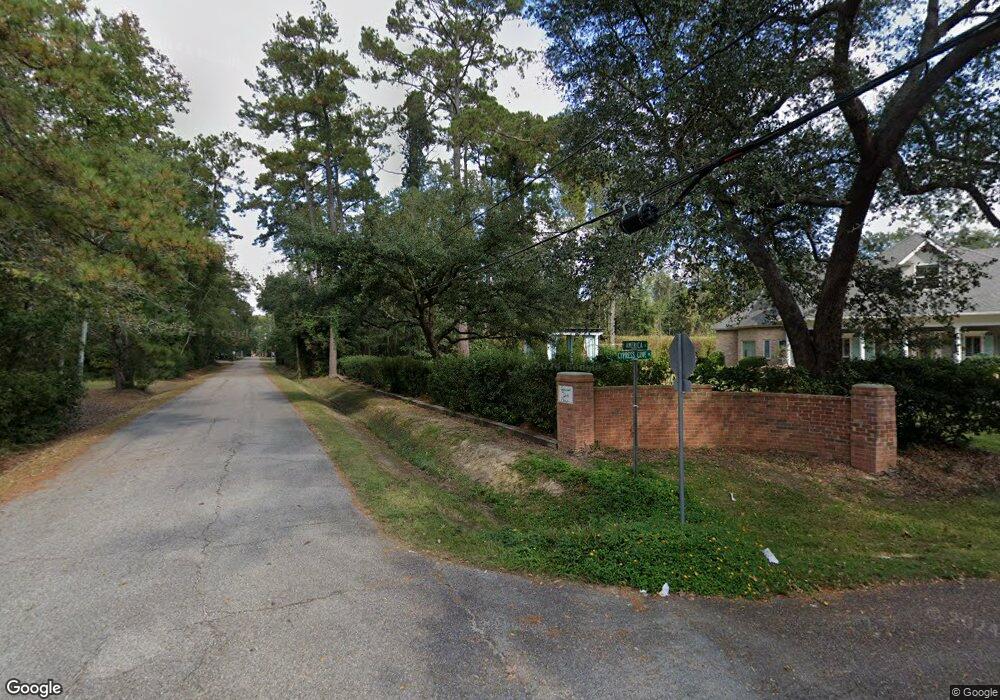
3 Cypress Cove Place Covington, LA 70433
Estimated Value: $884,000 - $1,440,000
5
Beds
6
Baths
4,770
Sq Ft
$251/Sq Ft
Est. Value
About This Home
This home is located at 3 Cypress Cove Place, Covington, LA 70433 and is currently estimated at $1,196,296, approximately $250 per square foot. 3 Cypress Cove Place is a home located in St. Tammany Parish with nearby schools including Covington Elementary School, William Pitcher Junior High School, and Pine View Middle School.
Ownership History
Date
Name
Owned For
Owner Type
Purchase Details
Closed on
Jan 22, 2024
Sold by
Benjamin Reina Jason and Hotard Rachel
Bought by
Reina Jason Benjamin and Reina Rachel Hotard
Current Estimated Value
Purchase Details
Closed on
May 30, 2022
Sold by
Kay Fanning Rachel
Bought by
Fanning Scott T and Fanning Angela B
Purchase Details
Closed on
Mar 27, 2008
Sold by
Jacobs Jamus H and Jacobs Linda Henderson
Bought by
Horard Reina Jason Benjamin and Horard Reina Rachel
Home Financials for this Owner
Home Financials are based on the most recent Mortgage that was taken out on this home.
Original Mortgage
$1,032,665
Interest Rate
5.72%
Mortgage Type
Purchase Money Mortgage
Create a Home Valuation Report for This Property
The Home Valuation Report is an in-depth analysis detailing your home's value as well as a comparison with similar homes in the area
Home Values in the Area
Average Home Value in this Area
Purchase History
| Date | Buyer | Sale Price | Title Company |
|---|---|---|---|
| Reina Jason Benjamin | -- | None Listed On Document | |
| Fanning Scott T | -- | None Listed On Document | |
| Horard Reina Jason Benjamin | $1,214,900 | None Available |
Source: Public Records
Mortgage History
| Date | Status | Borrower | Loan Amount |
|---|---|---|---|
| Previous Owner | Horard Reina Jason Benjamin | $1,032,665 |
Source: Public Records
Tax History Compared to Growth
Tax History
| Year | Tax Paid | Tax Assessment Tax Assessment Total Assessment is a certain percentage of the fair market value that is determined by local assessors to be the total taxable value of land and additions on the property. | Land | Improvement |
|---|---|---|---|---|
| 2024 | $10,167 | $98,873 | $22,500 | $76,373 |
| 2023 | $10,167 | $88,024 | $22,500 | $65,524 |
| 2022 | $968,090 | $88,024 | $22,500 | $65,524 |
| 2021 | $9,666 | $88,024 | $22,500 | $65,524 |
| 2020 | $9,693 | $88,024 | $22,500 | $65,524 |
| 2019 | $11,631 | $94,262 | $28,738 | $65,524 |
| 2018 | $11,645 | $94,262 | $28,738 | $65,524 |
| 2017 | $11,760 | $94,262 | $28,738 | $65,524 |
| 2016 | $11,816 | $94,262 | $28,738 | $65,524 |
| 2015 | $12,170 | $100,841 | $14,875 | $85,966 |
| 2014 | $12,054 | $100,841 | $14,875 | $85,966 |
| 2013 | -- | $100,841 | $14,875 | $85,966 |
Source: Public Records
Map
Nearby Homes
- 3 Cypress Cove Place
- 3 Cypress Cove Place
- 2 Cypress Cove Place
- 4 Cypress Cove Place
- 0 Cypress Cove Place
- 12 Cypress Cove Place
- 5 Cypress Cove Place
- 5 Cypress Cove Place
- 6 Cypress Cove Place
- 1 Cypress Cove Place
- 2316 S America St
- 2140 S America St
- 903 E 1st Ave
- 907 E 1st Ave
- 2211 S America St
- 722 Phyllis Dr
- 839 E 1st Ave
- 929 E 1st Ave
- 708 Phyllis Dr
- 904 E 1st Ave