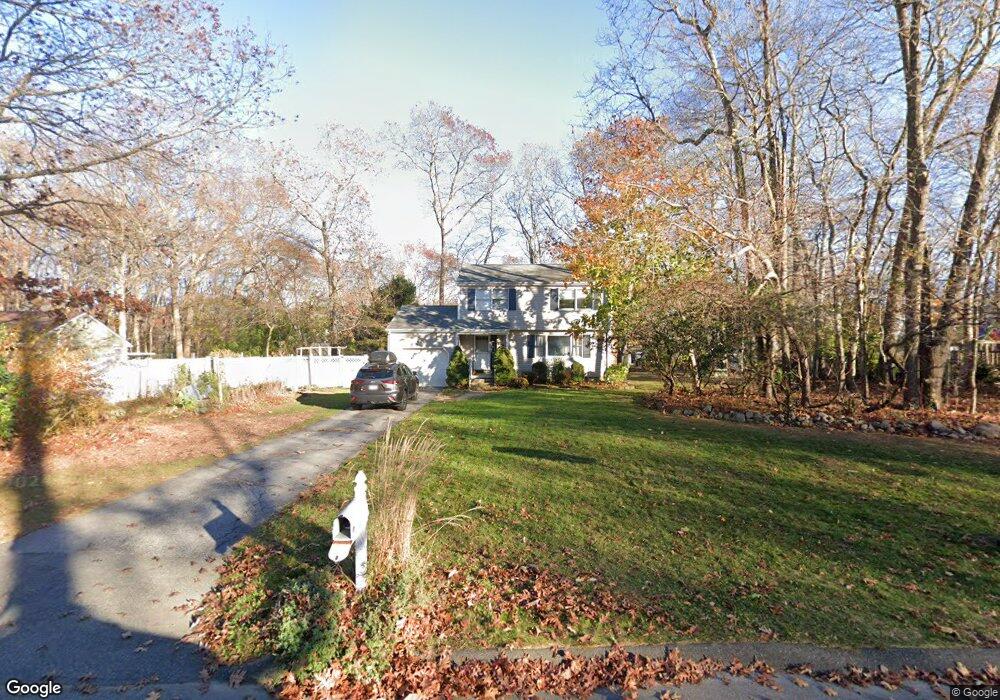
3 Cypress Way Niantic, CT 06357
Estimated Value: $442,623 - $498,000
3
Beds
2
Baths
1,516
Sq Ft
$313/Sq Ft
Est. Value
About This Home
This home is located at 3 Cypress Way, Niantic, CT 06357 and is currently estimated at $474,406, approximately $312 per square foot. 3 Cypress Way is a home located in New London County with nearby schools including East Lyme Middle School, East Lyme High School, and The Light House Voc-Ed Center.
Ownership History
Date
Name
Owned For
Owner Type
Purchase Details
Closed on
Oct 5, 2020
Sold by
Koziatek Laura and Wanstall Elizabeth
Bought by
Radack James S
Current Estimated Value
Home Financials for this Owner
Home Financials are based on the most recent Mortgage that was taken out on this home.
Original Mortgage
$257,248
Outstanding Balance
$228,808
Interest Rate
2.9%
Mortgage Type
New Conventional
Estimated Equity
$245,598
Purchase Details
Closed on
May 29, 2008
Sold by
Primary Closing Corp
Bought by
Rodriguez-Torres Luis and Mccue Rebecca
Home Financials for this Owner
Home Financials are based on the most recent Mortgage that was taken out on this home.
Original Mortgage
$316,950
Interest Rate
5.91%
Purchase Details
Closed on
Jul 14, 2000
Sold by
Dowd Thomas A and Ciaston Ermine
Bought by
Caizzi Paul L
Purchase Details
Closed on
Jun 29, 1988
Sold by
Sexauer Jane
Bought by
Dilullo Anthony
Create a Home Valuation Report for This Property
The Home Valuation Report is an in-depth analysis detailing your home's value as well as a comparison with similar homes in the area
Home Values in the Area
Average Home Value in this Area
Purchase History
| Date | Buyer | Sale Price | Title Company |
|---|---|---|---|
| Radack James S | $259,000 | None Available | |
| Rodriguez-Torres Luis | $322,000 | -- | |
| Primary Closing Corp | $320,000 | -- | |
| Caizzi Paul L | $176,900 | -- | |
| Dilullo Anthony | $180,750 | -- |
Source: Public Records
Mortgage History
| Date | Status | Borrower | Loan Amount |
|---|---|---|---|
| Open | Radack James S | $257,248 | |
| Previous Owner | Dilullo Anthony | $301,697 | |
| Previous Owner | Dilullo Anthony | $316,950 | |
| Previous Owner | Dilullo Anthony | $100,000 |
Source: Public Records
Tax History
| Year | Tax Paid | Tax Assessment Tax Assessment Total Assessment is a certain percentage of the fair market value that is determined by local assessors to be the total taxable value of land and additions on the property. | Land | Improvement |
|---|---|---|---|---|
| 2025 | $5,559 | $198,450 | $91,070 | $107,380 |
| 2024 | $5,229 | $198,450 | $91,070 | $107,380 |
| 2023 | $4,937 | $198,450 | $91,070 | $107,380 |
| 2022 | $4,731 | $198,450 | $91,070 | $107,380 |
| 2021 | $4,822 | $169,120 | $91,070 | $78,050 |
| 2020 | $4,796 | $169,120 | $91,070 | $78,050 |
| 2019 | $4,767 | $169,120 | $91,070 | $78,050 |
| 2018 | $4,625 | $169,120 | $91,070 | $78,050 |
| 2017 | $4,424 | $169,120 | $91,070 | $78,050 |
| 2016 | $4,269 | $168,350 | $91,070 | $77,280 |
| 2015 | $4,160 | $168,350 | $91,070 | $77,280 |
| 2014 | $4,045 | $168,350 | $91,070 | $77,280 |
Source: Public Records
Map
Nearby Homes
- 37 Stoneywood Dr
- 46 Village Crossing Unit 46
- 82 Roxbury Rd
- 80 Roxbury Rd
- 47 Village Crossing Unit 47
- 97 W Main St Unit 36
- 10 S Ledge Rock Rd
- 43 Roxbury Ct
- 468 Main St Unit 318
- 468 Main St Unit 111
- 47 Oswegatchie Hills Rd
- 55 Corey Ln
- 86 Corey Ln
- 185 Main St Unit 301
- 185 Main St Unit 305
- 11 Smith Ave
- 42 S Washington Ave
- 23 Central Ave
- 20 North Rd
- 19 Sapia Dr
- 19 Stoneywood Dr
- 5 Cypress Way
- 4 Old Oak Ln
- 6 Old Oak Ln
- 15 Stoneywood Dr
- 4 Cypress Way
- 23 Stoneywood Dr
- 7 Cypress Way
- 25 Stoneywood Dr
- 76 Stoneywood Dr
- 8 Cypress Way
- 75 Stoneywood Dr
- 1 Old Oak Ln
- 3 Old Oak Ln
- 22 Stoneywood Dr
- 14 Stoneywood Dr
- 5 Old Oak Ln
- 24 Stoneywood Dr
- 27 Stoneywood Dr
- 10 Stoneywood Dr
Your Personal Tour Guide
Ask me questions while you tour the home.