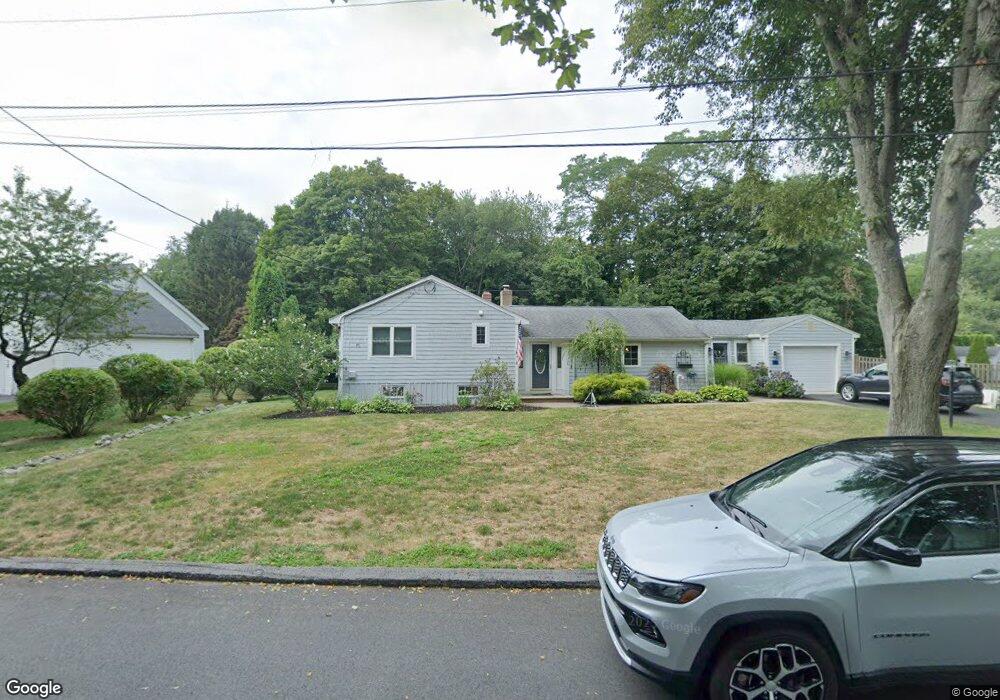
3 Day Ave Danvers, MA 01923
Estimated Value: $885,211 - $1,058,000
4
Beds
3
Baths
2,116
Sq Ft
$452/Sq Ft
Est. Value
About This Home
This home is located at 3 Day Ave, Danvers, MA 01923 and is currently estimated at $957,303, approximately $452 per square foot. 3 Day Ave is a home located in Essex County with nearby schools including St. Mary of the Annunciation School and St. John's Prep.
Ownership History
Date
Name
Owned For
Owner Type
Purchase Details
Closed on
Nov 7, 2011
Sold by
Robbin Stuart A
Bought by
Robbin Victoria J
Current Estimated Value
Home Financials for this Owner
Home Financials are based on the most recent Mortgage that was taken out on this home.
Original Mortgage
$0
Interest Rate
3.31%
Purchase Details
Closed on
Jun 16, 1994
Sold by
Prime Investment T
Bought by
Robbin Victoria
Create a Home Valuation Report for This Property
The Home Valuation Report is an in-depth analysis detailing your home's value as well as a comparison with similar homes in the area
Home Values in the Area
Average Home Value in this Area
Purchase History
| Date | Buyer | Sale Price | Title Company |
|---|---|---|---|
| Robbin Victoria J | -- | -- | |
| Robbin Victoria J | -- | -- | |
| Robbin Victoria | $230,000 | -- |
Source: Public Records
Mortgage History
| Date | Status | Borrower | Loan Amount |
|---|---|---|---|
| Closed | Robbin Victoria | $0 | |
| Previous Owner | Robbin Victoria | $240,000 |
Source: Public Records
Tax History Compared to Growth
Tax History
| Year | Tax Paid | Tax Assessment Tax Assessment Total Assessment is a certain percentage of the fair market value that is determined by local assessors to be the total taxable value of land and additions on the property. | Land | Improvement |
|---|---|---|---|---|
| 2025 | $8,330 | $758,000 | $407,700 | $350,300 |
| 2024 | $8,241 | $741,800 | $401,000 | $340,800 |
| 2023 | $7,875 | $670,200 | $367,000 | $303,200 |
| 2022 | $7,434 | $587,200 | $326,500 | $260,700 |
| 2021 | $7,269 | $544,500 | $322,500 | $222,000 |
| 2020 | $7,045 | $539,400 | $322,500 | $216,900 |
| 2019 | $6,769 | $509,700 | $292,800 | $216,900 |
| 2018 | $6,728 | $496,900 | $292,800 | $204,100 |
| 2017 | $6,476 | $456,400 | $252,300 | $204,100 |
| 2016 | $6,289 | $442,900 | $238,800 | $204,100 |
| 2015 | $6,036 | $404,800 | $218,500 | $186,300 |
Source: Public Records
Map
Nearby Homes
- 12 Exeter St
- 42 Coolidge Rd
- 6 Colby Rd
- 4 Chatham Ln
- 26 Mohawk St
- 78 North St
- 35 Locust St Unit 3
- 4 Brookvale Dr
- 11 Spring St
- 10 Colantoni Dr
- 6 Kimberly Dr
- 12 Whipple St
- 100 Poplar St
- 3 Middlewood Dr Unit 3
- 1 Morgan Dr
- 25 Cherry St Unit 3
- 8 Putnam St Unit 3
- 14 Williams St Unit C17
- 38 High St Unit 4
- 35 High St Unit 3D