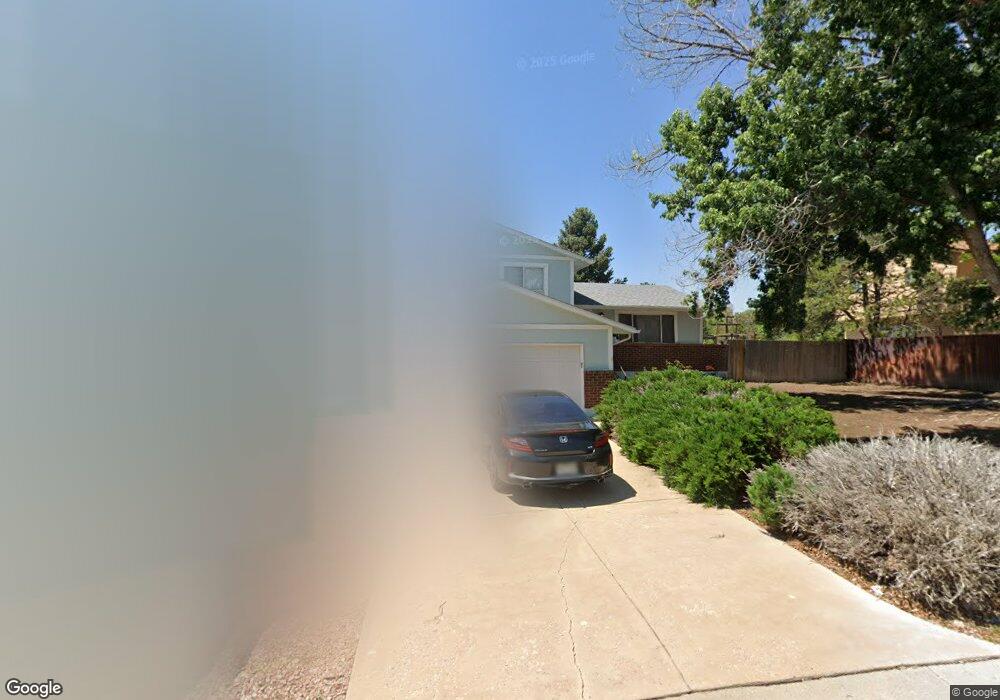
3 Dover Ln Pueblo, CO 81001
Belmont NeighborhoodEstimated Value: $301,786 - $346,000
3
Beds
3
Baths
1,602
Sq Ft
$203/Sq Ft
Est. Value
About This Home
This home is located at 3 Dover Ln, Pueblo, CO 81001 and is currently estimated at $324,697, approximately $202 per square foot. 3 Dover Ln is a home located in Pueblo County with nearby schools including Belmont Elementary School, Heaton Middle School, and East High School.
Ownership History
Date
Name
Owned For
Owner Type
Purchase Details
Closed on
Mar 26, 2019
Sold by
Cooter Kevin L
Bought by
Looter Kevin and Looter Cathy
Current Estimated Value
Purchase Details
Closed on
Apr 15, 2003
Sold by
Cooter Kevin L + Cathy M
Bought by
Cooter Kevin L
Purchase Details
Closed on
Nov 9, 1999
Sold by
Cooter Kevin L
Bought by
Cooter Kevin L + Cathy M
Purchase Details
Closed on
Oct 18, 1999
Sold by
Oro Mortgage Llc
Bought by
Cooter Kevin L
Purchase Details
Closed on
Oct 7, 1999
Sold by
Copper Mountain Lodging
Bought by
Oro Mortgage Llc
Purchase Details
Closed on
Aug 13, 1999
Sold by
Oro Mortgage Llc
Bought by
Copper Mountain Lodging
Purchase Details
Closed on
Feb 24, 1999
Sold by
Deherrera Jimmy G + Betty A
Bought by
Oro Mortgage Llc
Purchase Details
Closed on
Mar 31, 1983
Sold by
Reynolds Ronald D + Carol L
Bought by
Deherrera Jimmy G + Betty A
Purchase Details
Closed on
Apr 8, 1975
Bought by
Reynolds Ronald D + Carol L
Create a Home Valuation Report for This Property
The Home Valuation Report is an in-depth analysis detailing your home's value as well as a comparison with similar homes in the area
Home Values in the Area
Average Home Value in this Area
Purchase History
| Date | Buyer | Sale Price | Title Company |
|---|---|---|---|
| Looter Kevin | -- | None Available | |
| Cooter Kevin L | -- | -- | |
| Cooter Kevin L + Cathy M | -- | -- | |
| Cooter Kevin L | $144,000 | -- | |
| Oro Mortgage Llc | -- | -- | |
| Copper Mountain Lodging | -- | -- | |
| Oro Mortgage Llc | -- | -- | |
| Deherrera Jimmy G + Betty A | $69,900 | -- | |
| Reynolds Ronald D + Carol L | -- | -- |
Source: Public Records
Tax History
| Year | Tax Paid | Tax Assessment Tax Assessment Total Assessment is a certain percentage of the fair market value that is determined by local assessors to be the total taxable value of land and additions on the property. | Land | Improvement |
|---|---|---|---|---|
| 2024 | $1,607 | $16,400 | -- | -- |
| 2023 | $1,626 | $20,090 | $2,350 | $17,740 |
| 2022 | $1,530 | $15,410 | $2,430 | $12,980 |
| 2021 | $1,578 | $15,850 | $2,500 | $13,350 |
| 2020 | $1,362 | $15,850 | $2,500 | $13,350 |
| 2019 | $1,362 | $13,492 | $1,073 | $12,419 |
| 2018 | $991 | $10,941 | $1,080 | $9,861 |
| 2017 | $1,001 | $10,941 | $1,080 | $9,861 |
| 2016 | $958 | $10,539 | $1,194 | $9,345 |
| 2015 | $954 | $10,539 | $1,194 | $9,345 |
| 2014 | $949 | $10,463 | $1,194 | $9,269 |
Source: Public Records
Map
Nearby Homes
- 7 Briargate Terrace
- 12 Briargate Terrace
- 1 Briargate Place
- 23 Newpark Ln
- TBD Carefree Ln
- 3 Carousel Ln
- 45 Belvista Ct
- 182 Gamble Ln
- 55 Briargate Terrace
- 162 Gamble Ln Unit M
- 160 Gamble Ln
- 20 Robertson Rd
- 12 Harrogate Terrace
- 35 Macarthur Rd
- 18 Macgregor Rd
- 38 Macalester Rd
- 69 Macnaughton Rd
- 60 Loch Lomond Ln
- 1604 Bunker Hill Rd
- 52 Villa Dr