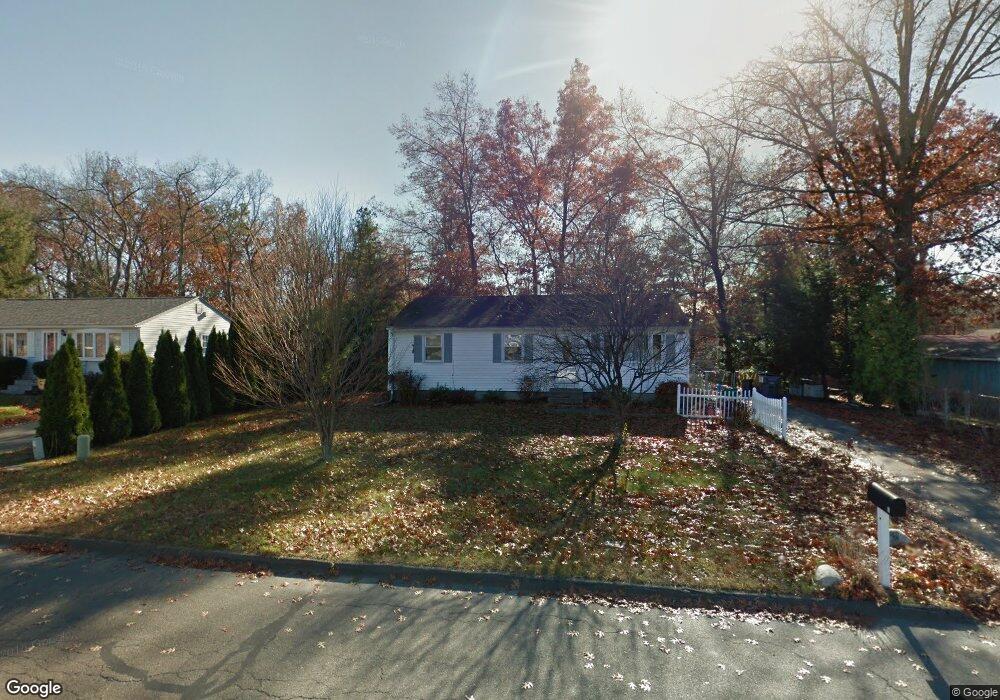
3 Droy Cir Easthampton, MA 01027
Estimated Value: $328,695 - $342,000
3
Beds
1
Bath
960
Sq Ft
$348/Sq Ft
Est. Value
About This Home
This home is located at 3 Droy Cir, Easthampton, MA 01027 and is currently estimated at $334,174, approximately $348 per square foot. 3 Droy Cir is a home located in Hampshire County with nearby schools including Easthampton High School, Calvary Baptist Christian School, and Tri-County Schools.
Ownership History
Date
Name
Owned For
Owner Type
Purchase Details
Closed on
Dec 21, 1998
Sold by
Alberts Ellen K
Bought by
Hyde Amy S and Hyde Robert J
Current Estimated Value
Home Financials for this Owner
Home Financials are based on the most recent Mortgage that was taken out on this home.
Original Mortgage
$80,995
Interest Rate
6.85%
Mortgage Type
Purchase Money Mortgage
Create a Home Valuation Report for This Property
The Home Valuation Report is an in-depth analysis detailing your home's value as well as a comparison with similar homes in the area
Home Values in the Area
Average Home Value in this Area
Purchase History
| Date | Buyer | Sale Price | Title Company |
|---|---|---|---|
| Hyde Amy S | $83,500 | -- |
Source: Public Records
Mortgage History
| Date | Status | Borrower | Loan Amount |
|---|---|---|---|
| Open | Hyde Amy S | $100,000 | |
| Closed | Hyde Amy S | $80,995 | |
| Previous Owner | Hyde Amy S | $25,000 |
Source: Public Records
Tax History
| Year | Tax Paid | Tax Assessment Tax Assessment Total Assessment is a certain percentage of the fair market value that is determined by local assessors to be the total taxable value of land and additions on the property. | Land | Improvement |
|---|---|---|---|---|
| 2025 | $4,283 | $313,300 | $118,300 | $195,000 |
| 2024 | $4,134 | $304,900 | $114,900 | $190,000 |
| 2023 | $3,145 | $214,700 | $90,400 | $124,300 |
| 2022 | $3,549 | $214,700 | $90,400 | $124,300 |
| 2021 | $3,876 | $221,000 | $90,400 | $130,600 |
| 2020 | $3,813 | $214,700 | $90,400 | $124,300 |
| 2019 | $2,970 | $192,100 | $90,400 | $101,700 |
| 2018 | $2,851 | $178,200 | $85,400 | $92,800 |
| 2017 | $2,782 | $171,600 | $82,100 | $89,500 |
| 2016 | $2,861 | $183,500 | $82,100 | $101,400 |
| 2015 | $2,780 | $183,500 | $82,100 | $101,400 |
Source: Public Records
Map
Nearby Homes
Your Personal Tour Guide
Ask me questions while you tour the home.