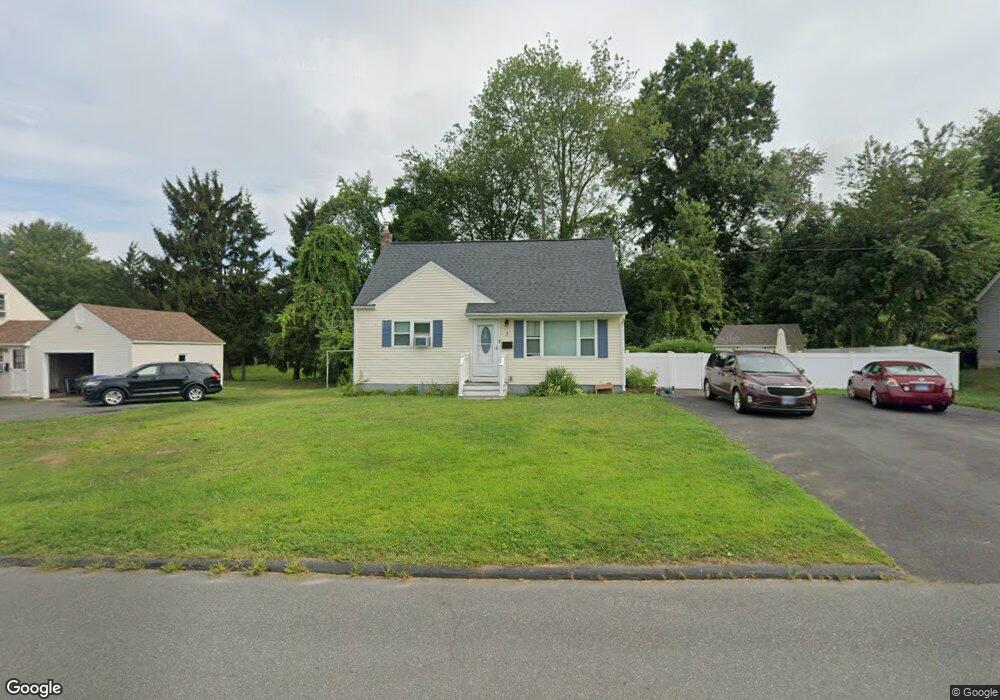
3 Eleanor Rd Enfield, CT 06082
Estimated Value: $274,000 - $317,000
4
Beds
2
Baths
1,152
Sq Ft
$251/Sq Ft
Est. Value
About This Home
This home is located at 3 Eleanor Rd, Enfield, CT 06082 and is currently estimated at $289,438, approximately $251 per square foot. 3 Eleanor Rd is a home located in Hartford County with nearby schools including Prudence Crandall Elementary School, Henry Barnard Elementary School, and John F. Kennedy Middle School.
Ownership History
Date
Name
Owned For
Owner Type
Purchase Details
Closed on
Jan 9, 2023
Sold by
Prime Prop Connection Llc
Bought by
Skrzypek Brent
Current Estimated Value
Home Financials for this Owner
Home Financials are based on the most recent Mortgage that was taken out on this home.
Original Mortgage
$203,500
Outstanding Balance
$196,891
Interest Rate
6.33%
Mortgage Type
Stand Alone Refi Refinance Of Original Loan
Estimated Equity
$92,547
Purchase Details
Closed on
Nov 7, 2017
Sold by
Morrison John Joseph E
Bought by
Buffalo Llc
Create a Home Valuation Report for This Property
The Home Valuation Report is an in-depth analysis detailing your home's value as well as a comparison with similar homes in the area
Home Values in the Area
Average Home Value in this Area
Purchase History
| Date | Buyer | Sale Price | Title Company |
|---|---|---|---|
| Skrzypek Brent | -- | None Available | |
| Skrzypek Brent | -- | None Available | |
| Buffalo Llc | $80,000 | -- | |
| Buffalo Llc | $80,000 | -- |
Source: Public Records
Mortgage History
| Date | Status | Borrower | Loan Amount |
|---|---|---|---|
| Open | Skrzypek Brent | $203,500 | |
| Closed | Skrzypek Brent | $203,500 | |
| Previous Owner | Buffalo Llc | $125,000 |
Source: Public Records
Tax History Compared to Growth
Tax History
| Year | Tax Paid | Tax Assessment Tax Assessment Total Assessment is a certain percentage of the fair market value that is determined by local assessors to be the total taxable value of land and additions on the property. | Land | Improvement |
|---|---|---|---|---|
| 2025 | $5,225 | $150,800 | $46,400 | $104,400 |
| 2024 | $5,099 | $150,800 | $46,400 | $104,400 |
| 2023 | $5,016 | $150,800 | $46,400 | $104,400 |
| 2022 | $4,570 | $149,400 | $46,400 | $103,000 |
| 2021 | $4,293 | $114,860 | $38,430 | $76,430 |
| 2020 | $4,293 | $114,860 | $38,430 | $76,430 |
| 2019 | $4,293 | $114,860 | $38,430 | $76,430 |
| 2018 | $3,461 | $94,700 | $38,430 | $56,270 |
| 2017 | $3,275 | $94,700 | $38,430 | $56,270 |
| 2016 | $3,172 | $93,270 | $38,430 | $54,840 |
| 2015 | $3,082 | $93,270 | $38,430 | $54,840 |
| 2014 | $3,011 | $93,270 | $38,430 | $54,840 |
Source: Public Records
Map
Nearby Homes