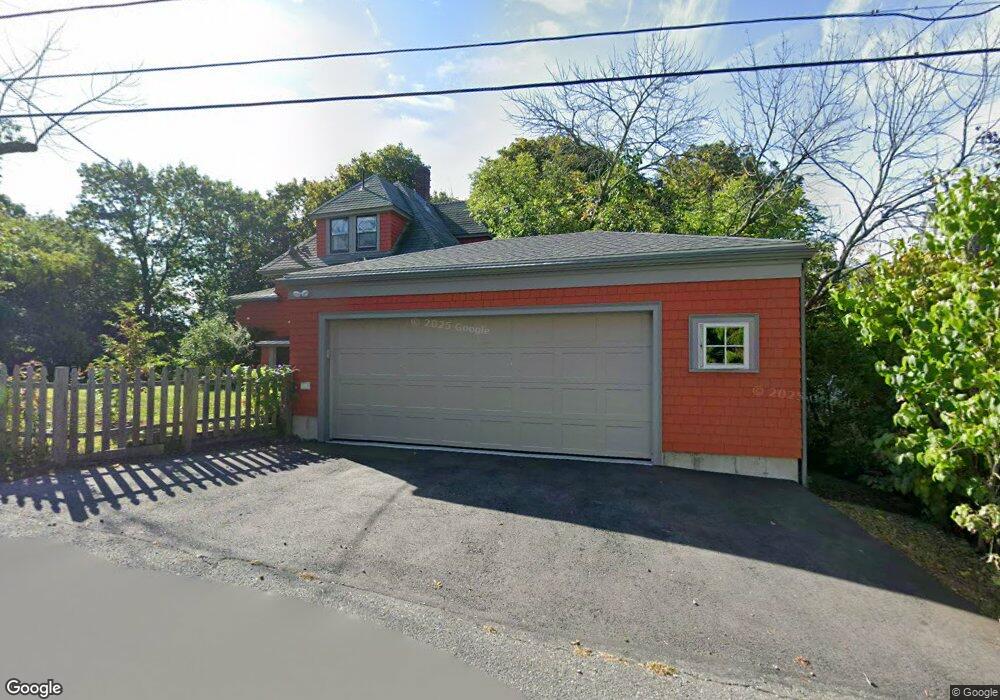
3 Ellery St Gloucester, MA 01930
Estimated Value: $570,000 - $684,000
3
Beds
2
Baths
1,185
Sq Ft
$544/Sq Ft
Est. Value
About This Home
This home is located at 3 Ellery St, Gloucester, MA 01930 and is currently estimated at $644,942, approximately $544 per square foot. 3 Ellery St is a home located in Essex County with nearby schools including Beeman Memorial, Ralph B O'maley Middle School, and Gloucester High School.
Ownership History
Date
Name
Owned For
Owner Type
Purchase Details
Closed on
Jun 29, 2022
Sold by
Patchen David
Bought by
M A Patchen 2022 Ret and Patchen
Current Estimated Value
Purchase Details
Closed on
Aug 26, 2021
Sold by
Baker Ryan J and Mawson Leah
Bought by
Patchen David
Purchase Details
Closed on
Dec 29, 2017
Sold by
Arndt-Decastro Emily and Alves-Decastro Flavio
Bought by
Baker Ryan J and Mawson Leah
Home Financials for this Owner
Home Financials are based on the most recent Mortgage that was taken out on this home.
Original Mortgage
$417,302
Interest Rate
3.95%
Mortgage Type
FHA
Purchase Details
Closed on
Jun 22, 2012
Sold by
Johnson Shirley A Est and Doucette
Bought by
Decastro Flavio A and Decastro Emily A
Home Financials for this Owner
Home Financials are based on the most recent Mortgage that was taken out on this home.
Original Mortgage
$162,000
Interest Rate
3.84%
Mortgage Type
New Conventional
Create a Home Valuation Report for This Property
The Home Valuation Report is an in-depth analysis detailing your home's value as well as a comparison with similar homes in the area
Purchase History
| Date | Buyer | Sale Price | Title Company |
|---|---|---|---|
| M A Patchen 2022 Ret | -- | None Available | |
| Patchen David | $600,000 | None Available | |
| Baker Ryan J | $425,000 | -- | |
| Baker Ryan J | $425,000 | -- | |
| Decastro Flavio A | $200,000 | -- |
Source: Public Records
Mortgage History
| Date | Status | Borrower | Loan Amount |
|---|---|---|---|
| Previous Owner | Baker Ryan J | $417,302 | |
| Previous Owner | Decastro Flavio A | $162,000 |
Source: Public Records
Tax History
| Year | Tax Paid | Tax Assessment Tax Assessment Total Assessment is a certain percentage of the fair market value that is determined by local assessors to be the total taxable value of land and additions on the property. | Land | Improvement |
|---|---|---|---|---|
| 2025 | $5,567 | $572,700 | $186,700 | $386,000 |
| 2024 | $5,202 | $534,600 | $143,000 | $391,600 |
| 2023 | $4,874 | $460,200 | $127,700 | $332,500 |
| 2022 | $4,360 | $371,700 | $111,100 | $260,600 |
| 2021 | $4,319 | $347,200 | $101,000 | $246,200 |
| 2020 | $4,339 | $351,900 | $101,000 | $250,900 |
| 2019 | $4,261 | $335,800 | $101,000 | $234,800 |
| 2018 | $3,521 | $272,300 | $101,000 | $171,300 |
| 2017 | $3,431 | $260,100 | $96,200 | $163,900 |
| 2016 | $3,094 | $227,300 | $100,300 | $127,000 |
| 2015 | $2,976 | $218,000 | $100,300 | $117,700 |
Source: Public Records
Map
Nearby Homes
- 13 Mystic Ave
- 8 Mystic Ave
- 6 Monroe Ct
- 31 Echo Ave
- 98 Maplewood Ave
- 9 Cleveland Place
- 12 Arthur St
- 40 Sargent St
- 3 Deacon Farm Ln
- 15 Harvard St
- 33 Maplewood Ave Unit 310
- 19 Trask St Unit 2
- 113 Pleasant St
- 50 Warner St
- 13 Honeysuckle Rd
- 20 Beacon St
- 20 Beacon St Unit 2
- 20 Beacon St Unit 1
- 15 Mount Vernon St
- 33 Middle St
Your Personal Tour Guide
Ask me questions while you tour the home.