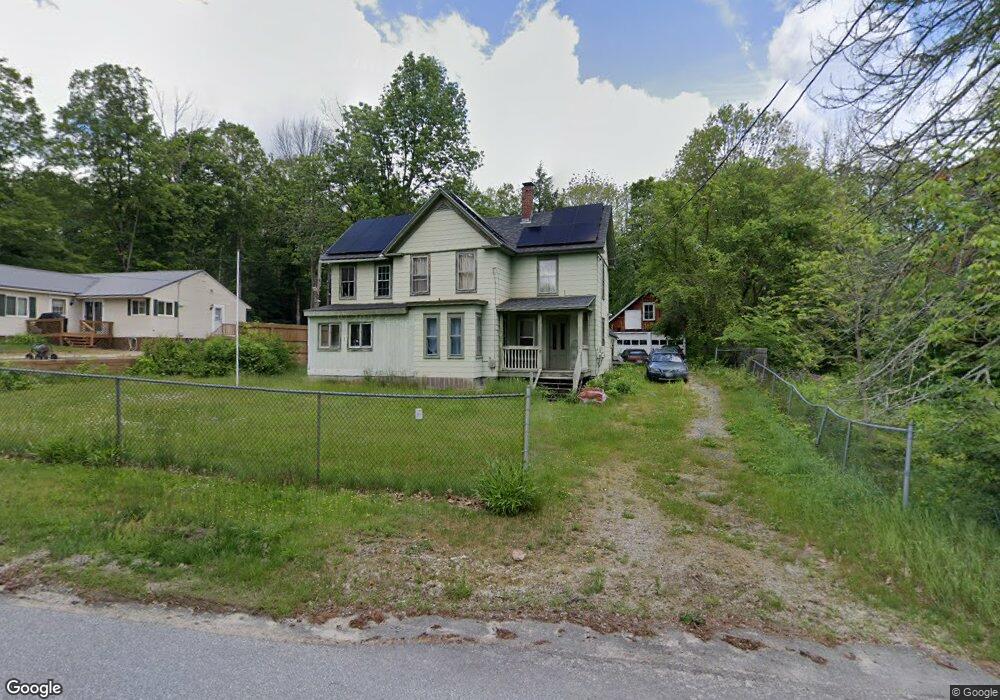
3 Elm St Antrim, NH 03440
Estimated Value: $298,000 - $443,000
3
Beds
3
Baths
1,467
Sq Ft
$240/Sq Ft
Est. Value
About This Home
This home is located at 3 Elm St, Antrim, NH 03440 and is currently estimated at $352,018, approximately $239 per square foot. 3 Elm St is a home located in Hillsborough County with nearby schools including Antrim Elementary School, Great Brook School, and Conval Regional High School.
Ownership History
Date
Name
Owned For
Owner Type
Purchase Details
Closed on
Aug 16, 2013
Sold by
Morales Ivan and Fnma
Bought by
Federal National Mortgage Association
Current Estimated Value
Purchase Details
Closed on
Jan 23, 2007
Sold by
Demartino Michael and Demartino Cyndy
Bought by
Morales Ivan and Morales Hollie Nicole
Home Financials for this Owner
Home Financials are based on the most recent Mortgage that was taken out on this home.
Original Mortgage
$148,500
Interest Rate
6.14%
Mortgage Type
Purchase Money Mortgage
Purchase Details
Closed on
Mar 4, 2005
Sold by
Allain Brian A and Allain Candace R
Bought by
Novastar Home Mtg
Purchase Details
Closed on
Jul 30, 2002
Sold by
Bruce L Ramsey Est
Bought by
Allain Brian A and Allain Candace R
Home Financials for this Owner
Home Financials are based on the most recent Mortgage that was taken out on this home.
Original Mortgage
$91,875
Interest Rate
6.73%
Mortgage Type
Purchase Money Mortgage
Create a Home Valuation Report for This Property
The Home Valuation Report is an in-depth analysis detailing your home's value as well as a comparison with similar homes in the area
Home Values in the Area
Average Home Value in this Area
Purchase History
| Date | Buyer | Sale Price | Title Company |
|---|---|---|---|
| Federal National Mortgage Association | $117,800 | -- | |
| Morales Ivan | $148,500 | -- | |
| Novastar Home Mtg | $125,300 | -- | |
| Allain Brian A | $122,500 | -- |
Source: Public Records
Mortgage History
| Date | Status | Borrower | Loan Amount |
|---|---|---|---|
| Previous Owner | Allain Brian A | $148,500 | |
| Previous Owner | Allain Brian A | $91,875 |
Source: Public Records
Tax History Compared to Growth
Tax History
| Year | Tax Paid | Tax Assessment Tax Assessment Total Assessment is a certain percentage of the fair market value that is determined by local assessors to be the total taxable value of land and additions on the property. | Land | Improvement |
|---|---|---|---|---|
| 2024 | $4,225 | $203,230 | $100,000 | $103,230 |
| 2023 | $3,809 | $203,230 | $100,000 | $103,230 |
| 2022 | $3,284 | $117,860 | $40,000 | $77,860 |
| 2021 | $3,073 | $117,860 | $40,000 | $77,860 |
| 2020 | $3,365 | $117,860 | $40,000 | $77,860 |
| 2019 | $2,912 | $107,960 | $40,000 | $67,960 |
| 2018 | $2,817 | $107,960 | $40,000 | $67,960 |
| 2016 | $2,816 | $100,680 | $38,000 | $62,680 |
| 2015 | $2,792 | $100,680 | $38,000 | $62,680 |
| 2012 | $3,181 | $134,370 | $47,380 | $86,990 |
Source: Public Records
Map
Nearby Homes
- 8 Wallace St
- 7 Elm Street Extension
- 17 West St
- 1 Goodell Rd
- 42 Pleasant St
- 0 Whiton Rd Unit 55
- 479 U S 202
- M16-L02 U S Highway 202
- 51 Whiton Rd
- 0 Bridle Path Rd Unit 5024544
- 50 Mulhall Farm Rd
- 15 Dodge Hill Rd
- 0 Meetinghouse Hill Rd Unit 37
- 2337 2nd Nh Turnpike
- 184 Francestown Rd
- 0 Concord St Unit 5041004
- 43 Greenfield Rd
- 151 U S 202
- 128 Onset Rd
- 0 Craig Rd Unit 5046605