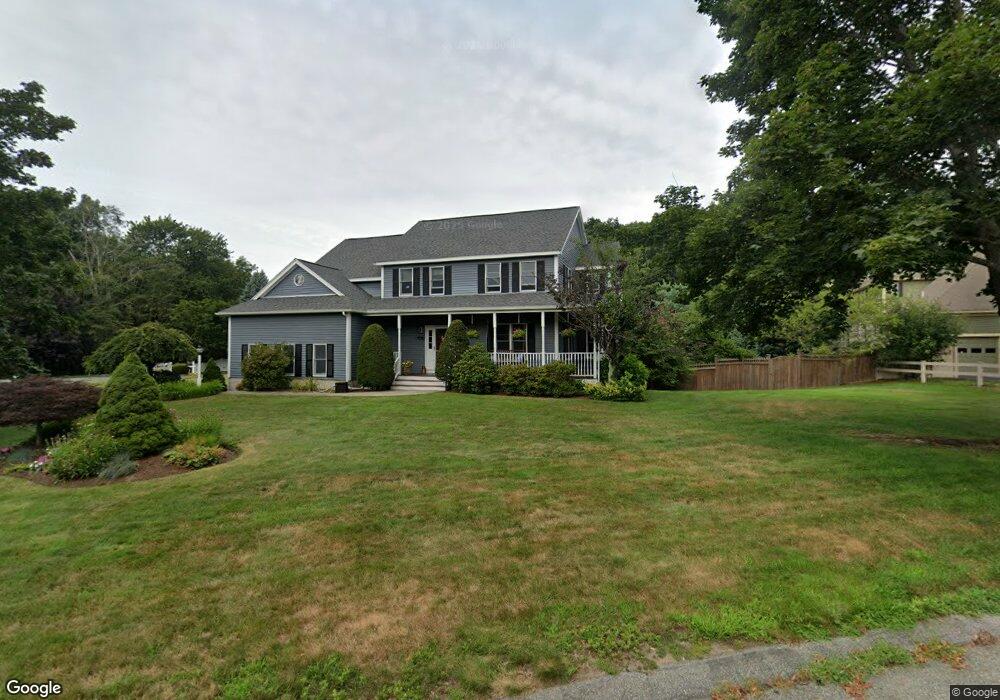
3 Emily Ln Danvers, MA 01923
Estimated Value: $1,159,248 - $1,399,000
4
Beds
3
Baths
2,600
Sq Ft
$484/Sq Ft
Est. Value
About This Home
This home is located at 3 Emily Ln, Danvers, MA 01923 and is currently estimated at $1,259,062, approximately $484 per square foot. 3 Emily Ln is a home located in Essex County with nearby schools including Danvers High School, St. Mary of the Annunciation School, and St. John's Prep.
Ownership History
Date
Name
Owned For
Owner Type
Purchase Details
Closed on
Jun 6, 1997
Sold by
Tcc Real Estate Dev
Bought by
Mistretta Thomas M and Mistretta Debra A
Current Estimated Value
Home Financials for this Owner
Home Financials are based on the most recent Mortgage that was taken out on this home.
Original Mortgage
$150,000
Interest Rate
7.98%
Mortgage Type
Purchase Money Mortgage
Create a Home Valuation Report for This Property
The Home Valuation Report is an in-depth analysis detailing your home's value as well as a comparison with similar homes in the area
Home Values in the Area
Average Home Value in this Area
Purchase History
| Date | Buyer | Sale Price | Title Company |
|---|---|---|---|
| Mistretta Thomas M | $350,000 | -- |
Source: Public Records
Mortgage History
| Date | Status | Borrower | Loan Amount |
|---|---|---|---|
| Open | Mistretta Thomas M | $140,000 | |
| Closed | Mistretta Thomas M | $150,000 |
Source: Public Records
Tax History Compared to Growth
Tax History
| Year | Tax Paid | Tax Assessment Tax Assessment Total Assessment is a certain percentage of the fair market value that is determined by local assessors to be the total taxable value of land and additions on the property. | Land | Improvement |
|---|---|---|---|---|
| 2025 | $11,531 | $1,049,200 | $418,700 | $630,500 |
| 2024 | $11,403 | $1,026,400 | $418,700 | $607,700 |
| 2023 | $11,013 | $937,300 | $389,000 | $548,300 |
| 2022 | $10,731 | $847,600 | $337,700 | $509,900 |
| 2021 | $10,143 | $759,800 | $310,700 | $449,100 |
| 2020 | $9,726 | $744,700 | $290,500 | $454,200 |
| 2019 | $9,720 | $731,900 | $290,500 | $441,400 |
| 2018 | $9,412 | $695,100 | $287,800 | $407,300 |
| 2017 | $9,053 | $638,000 | $256,700 | $381,300 |
| 2016 | $8,922 | $628,300 | $256,700 | $371,600 |
| 2015 | $8,734 | $585,800 | $236,400 | $349,400 |
Source: Public Records
Map
Nearby Homes
- 12 Exeter St
- 42 Coolidge Rd
- 35 Locust St Unit 3
- 4 Butler Ave
- 6 Colby Rd
- 4 Chatham Ln
- 6 Kimberly Dr
- 20 Central Ave
- 11 Spring St
- 12 Central Ave Unit 1
- 78 North St
- 14 Williams St Unit C17
- 38 High St Unit 4
- 35 High St Unit 3D
- 10 Paulette Dr
- 7 Riverbank Ave Unit 7
- 7 Riverbank Ave
- 11 Riverside Ave Unit 111
- 35 Bayview Terrace Unit 7
- 6 Bartlett Rd