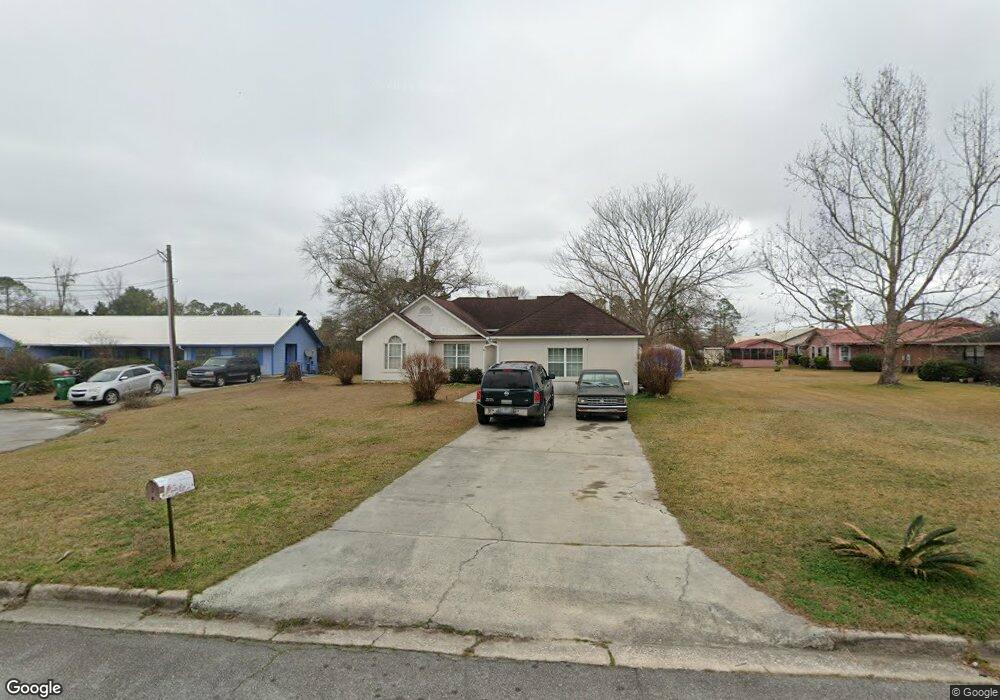
3 Fernwood Cir Valdosta, GA 31601
Estimated Value: $151,000 - $171,000
4
Beds
2
Baths
1,896
Sq Ft
$85/Sq Ft
Est. Value
About This Home
This home is located at 3 Fernwood Cir, Valdosta, GA 31601 and is currently estimated at $160,558, approximately $84 per square foot. 3 Fernwood Cir is a home located in Lowndes County with nearby schools including J.L. Lomax Elementary School, Newbern Middle School, and Valdosta High School.
Ownership History
Date
Name
Owned For
Owner Type
Purchase Details
Closed on
Oct 28, 2022
Sold by
Weaver Carrie B
Bought by
Miller Wallace and Miller Brendle
Current Estimated Value
Purchase Details
Closed on
Oct 20, 2020
Sold by
Weaver Carrie B
Bought by
Weaver Carrie B and Willis Harris Latonia
Purchase Details
Closed on
Dec 1, 2015
Sold by
Smith Gregory
Bought by
Smith Marco
Purchase Details
Closed on
Sep 25, 2009
Sold by
Smith Tracey B
Bought by
Smith Gregory Estate
Purchase Details
Closed on
Oct 3, 2006
Sold by
Howard Jerald A
Bought by
Smith Tracey B
Home Financials for this Owner
Home Financials are based on the most recent Mortgage that was taken out on this home.
Original Mortgage
$103,271
Interest Rate
6.45%
Mortgage Type
New Conventional
Purchase Details
Closed on
Oct 7, 1994
Sold by
Howard Doris K
Bought by
Howard Jerald A
Purchase Details
Closed on
Aug 11, 1988
Bought by
Howard Jerald A
Create a Home Valuation Report for This Property
The Home Valuation Report is an in-depth analysis detailing your home's value as well as a comparison with similar homes in the area
Home Values in the Area
Average Home Value in this Area
Purchase History
| Date | Buyer | Sale Price | Title Company |
|---|---|---|---|
| Miller Wallace | $120,000 | -- | |
| Weaver Carrie B | -- | -- | |
| Smith Marco | -- | -- | |
| Smith Gregory Estate | $90,900 | -- | |
| Herrera Ann J | -- | -- | |
| Smith Tracey B | $101,819 | -- | |
| Howard Jerald A | -- | -- | |
| Howard Jerald A | -- | -- |
Source: Public Records
Mortgage History
| Date | Status | Borrower | Loan Amount |
|---|---|---|---|
| Previous Owner | Smith Tracey B | $103,271 |
Source: Public Records
Tax History Compared to Growth
Tax History
| Year | Tax Paid | Tax Assessment Tax Assessment Total Assessment is a certain percentage of the fair market value that is determined by local assessors to be the total taxable value of land and additions on the property. | Land | Improvement |
|---|---|---|---|---|
| 2024 | $1,233 | $54,150 | $4,000 | $50,150 |
| 2023 | $1,233 | $52,667 | $4,000 | $48,667 |
| 2022 | $1,327 | $39,272 | $4,000 | $35,272 |
| 2021 | $1,365 | $39,272 | $4,000 | $35,272 |
| 2020 | $1,395 | $39,272 | $4,000 | $35,272 |
| 2019 | $1,394 | $39,272 | $4,000 | $35,272 |
| 2018 | $1,412 | $39,272 | $4,000 | $35,272 |
| 2017 | $1,422 | $39,272 | $4,000 | $35,272 |
| 2016 | $1,420 | $39,272 | $4,000 | $35,272 |
| 2015 | -- | $39,272 | $4,000 | $35,272 |
| 2014 | -- | $39,272 | $4,000 | $35,272 |
Source: Public Records
Map
Nearby Homes
- 1301 Bethune St
- 1306 Bethune St
- 1302 Bethune St
- 1314 Partridge Place
- 10 Lavista Cir
- 4 Martin Luther King jr Cir
- 914 Bethune St
- 703 New Hudson St
- 420 Griffin Ave
- 1412 San Bernardino Way
- 0 Howell Rd
- 307 Wisenbaker Ln
- 0 Hampton Ln
- 200 Deloach St
- 214 Wisenbaker Ln
- 201 Cummings Place
- 805 Ponderosa Dr
- 807 Myrtle St
- 5604 Pasadena Way
- 506 Mystic St
- 1312 Willow Way
- 1314 Willow Way
- 5 Fernwood Cir
- 6 Fernwood Cir
- 4 Lantana Cir
- 7 Fernwood Cir
- 4 Fernwood Cir
- 8 Lantana Cir
- 1316 Willow Way
- 10 Fernwood Cir
- 1310 Willow Way
- 7 Lantana Cir
- 0 Willow Way
- 5 Lantana Cir
- 1322 Willow Way
- 1321 Willow Way
- 1311 Bethune St
- 1307 Bethune St
- 1411 Continental Dr
- 1313 Bethune St