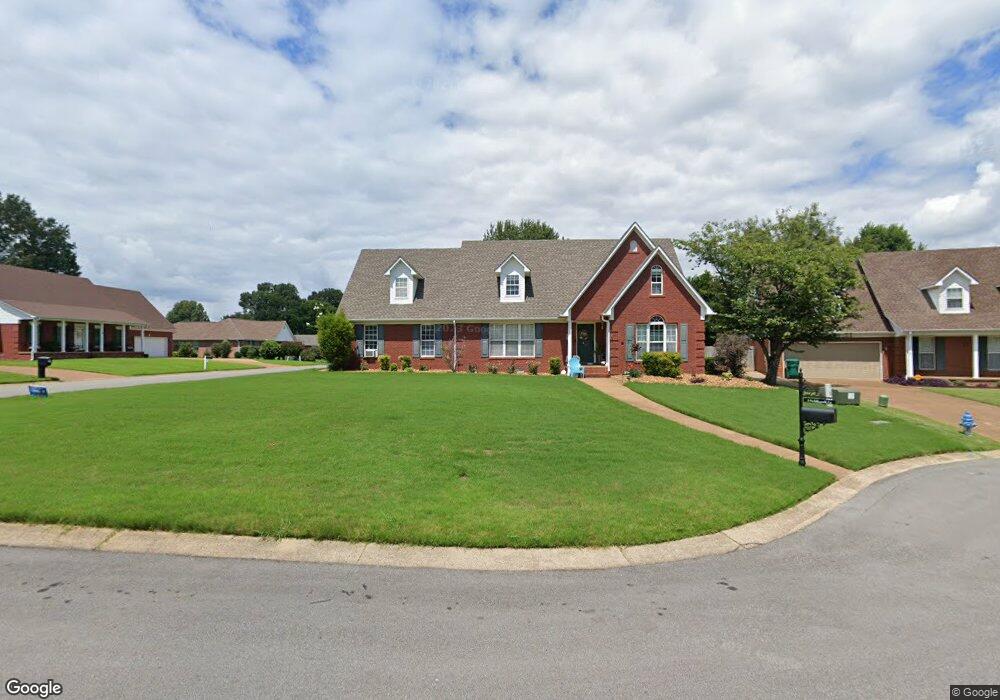
3 Fieldbrook Cove Jackson, TN 38305
Estimated Value: $297,496 - $378,000
4
Beds
3
Baths
3,375
Sq Ft
$100/Sq Ft
Est. Value
About This Home
This home is located at 3 Fieldbrook Cove, Jackson, TN 38305 and is currently estimated at $338,624, approximately $100 per square foot. 3 Fieldbrook Cove is a home located in Madison County with nearby schools including Pope School, Northeast Middle School, and North Side High School.
Ownership History
Date
Name
Owned For
Owner Type
Purchase Details
Closed on
Mar 21, 2013
Sold by
Harper Michael Gaines
Bought by
Odonnell Ashley B and Odonnell Patrick J
Current Estimated Value
Home Financials for this Owner
Home Financials are based on the most recent Mortgage that was taken out on this home.
Original Mortgage
$158,574
Outstanding Balance
$110,257
Interest Rate
3.37%
Mortgage Type
FHA
Estimated Equity
$228,367
Purchase Details
Closed on
Feb 10, 2009
Sold by
Mcclure Wesley C
Bought by
Harper Michael Gaines
Purchase Details
Closed on
Jun 13, 2008
Sold by
Mcclure Wesley C
Bought by
Mcclure Wesley C
Purchase Details
Closed on
Jun 30, 2006
Sold by
Cendant Mobility Financial
Bought by
Mcclure Wesley C
Home Financials for this Owner
Home Financials are based on the most recent Mortgage that was taken out on this home.
Original Mortgage
$36,150
Interest Rate
6.6%
Purchase Details
Closed on
Apr 28, 2006
Bought by
Mobility Cendant
Purchase Details
Closed on
May 3, 2000
Sold by
Humboldt Rd Ptnrs
Bought by
Amanda Nixon
Create a Home Valuation Report for This Property
The Home Valuation Report is an in-depth analysis detailing your home's value as well as a comparison with similar homes in the area
Purchase History
| Date | Buyer | Sale Price | Title Company |
|---|---|---|---|
| Odonnell Ashley B | $161,500 | -- | |
| Harper Michael Gaines | $155,000 | -- | |
| Mcclure Wesley C | -- | -- | |
| Mcclure Wesley C | $180,000 | -- | |
| Cendant Mobility Financial Cor | $180,000 | -- | |
| Mobility Cendant | $180,000 | -- | |
| Amanda Nixon | $160,300 | -- |
Source: Public Records
Mortgage History
| Date | Status | Borrower | Loan Amount |
|---|---|---|---|
| Open | Odonnell Ashley B | $158,574 | |
| Previous Owner | Amanda Nixon | $36,150 |
Source: Public Records
Tax History
| Year | Tax Paid | Tax Assessment Tax Assessment Total Assessment is a certain percentage of the fair market value that is determined by local assessors to be the total taxable value of land and additions on the property. | Land | Improvement |
|---|---|---|---|---|
| 2025 | $1,186 | $63,325 | $6,875 | $56,450 |
| 2024 | $1,186 | $63,325 | $6,875 | $56,450 |
| 2022 | $2,206 | $63,325 | $6,875 | $56,450 |
| 2021 | $1,698 | $39,375 | $4,000 | $35,375 |
| 2020 | $1,698 | $39,375 | $4,000 | $35,375 |
| 2019 | $1,698 | $39,375 | $4,000 | $35,375 |
| 2018 | $1,698 | $39,375 | $4,000 | $35,375 |
| 2017 | $1,661 | $37,650 | $4,000 | $33,650 |
| 2016 | $1,548 | $37,650 | $4,000 | $33,650 |
| 2015 | $1,548 | $37,650 | $4,000 | $33,650 |
| 2014 | $1,551 | $37,725 | $4,000 | $33,725 |
Source: Public Records
Map
Nearby Homes
- 63 Starwood Cove
- 11 Deer Pointe
- 00 Sterling Farm Dr
- 0 - A Sterling Farm Dr
- 0 - N Highway 45 Bypass Frontage
- 91 N Star Dr
- 72 Nolan Cove
- 44 Nolan Cove
- 71 Nolan Cove
- 85 Weatheridge Dr
- 9 Dayton Cove
- 2949 Highway 45 Bypass Frontage Rd
- 59 Livingston Way
- 0 Old Humboldt Rd
- 410 Fairway Blvd
- 669 Walker Rd
- 50 Windfield Cove
- 113 Water Ridge Place
- 25 Lamplighter Cove
- 87 Garrison Dr
- 7 Fieldbrook Cove
- 21 Ferndale Cove
- 4 Fieldbrook Cove
- 29 Ferndale Cove
- 13 Ferndale Cove
- 146 Greenhill Dr
- 8 Fieldbrook Cove
- 154 Greenhill Dr
- 12 Fieldbrook Cove
- 37 Ferndale Cove
- 5 Ferndale Cove
- 162 Greenhill Dr
- 46 Ferndale Cove
- 24 Starwood Cove
- 170 Greenhill Dr
- 45 Ferndale Cove
- 16 Starwood Cove
- 32 Starwood Cove
- 178 Jadewood Dr
- 8 Starwood Cove
Your Personal Tour Guide
Ask me questions while you tour the home.