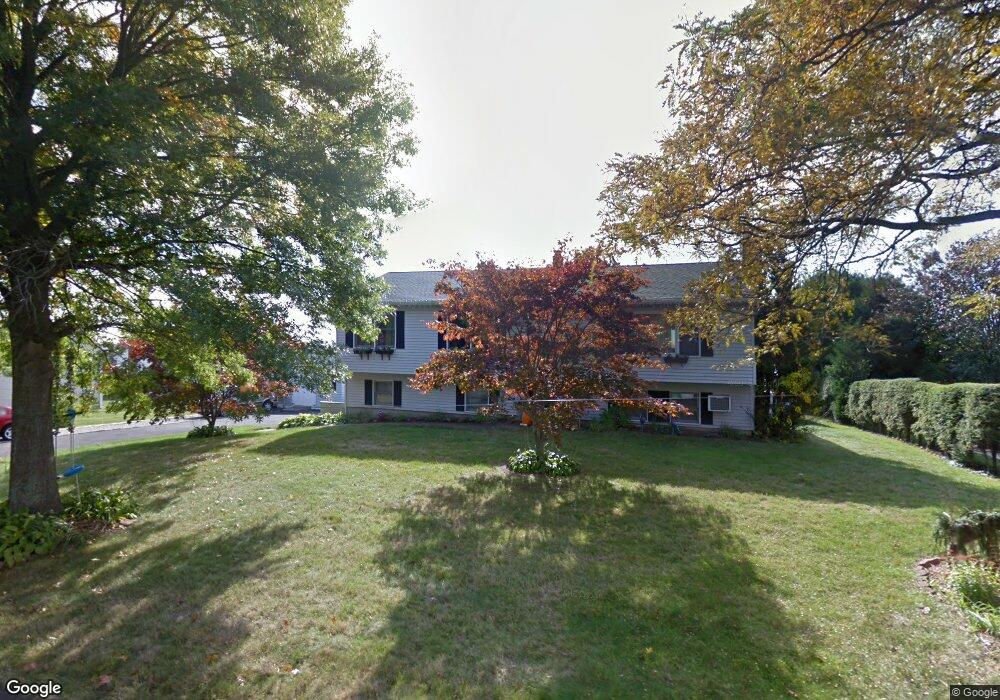
3 Finnucan Dr Ansonia, CT 06401
Estimated Value: $486,224 - $550,000
3
Beds
3
Baths
1,288
Sq Ft
$391/Sq Ft
Est. Value
About This Home
This home is located at 3 Finnucan Dr, Ansonia, CT 06401 and is currently estimated at $503,306, approximately $390 per square foot. 3 Finnucan Dr is a home located in New Haven County with nearby schools including Mead School, Prendergast School, and Ansonia Middle School.
Ownership History
Date
Name
Owned For
Owner Type
Purchase Details
Closed on
Apr 25, 2011
Sold by
Conte John R and Conte Lisa M
Bought by
Fourtin William and Fourtin Gina
Current Estimated Value
Home Financials for this Owner
Home Financials are based on the most recent Mortgage that was taken out on this home.
Original Mortgage
$95,000
Interest Rate
4.9%
Purchase Details
Closed on
Feb 27, 1998
Sold by
Bekalowicz Robert J
Bought by
Conte John R and Conte Lisa M
Create a Home Valuation Report for This Property
The Home Valuation Report is an in-depth analysis detailing your home's value as well as a comparison with similar homes in the area
Home Values in the Area
Average Home Value in this Area
Purchase History
| Date | Buyer | Sale Price | Title Company |
|---|---|---|---|
| Fourtin William | $284,000 | -- | |
| Conte John R | $157,000 | -- |
Source: Public Records
Mortgage History
| Date | Status | Borrower | Loan Amount |
|---|---|---|---|
| Closed | Conte John R | $95,000 | |
| Previous Owner | Conte John R | $32,105 | |
| Previous Owner | Conte John R | $139,500 | |
| Previous Owner | Conte John R | $14,000 |
Source: Public Records
Tax History Compared to Growth
Tax History
| Year | Tax Paid | Tax Assessment Tax Assessment Total Assessment is a certain percentage of the fair market value that is determined by local assessors to be the total taxable value of land and additions on the property. | Land | Improvement |
|---|---|---|---|---|
| 2025 | $7,534 | $263,900 | $66,710 | $197,190 |
| 2024 | $6,991 | $263,900 | $66,710 | $197,190 |
| 2023 | $6,925 | $263,900 | $66,710 | $197,190 |
| 2022 | $6,970 | $184,400 | $67,600 | $116,800 |
| 2021 | $6,970 | $184,400 | $67,600 | $116,800 |
| 2020 | $6,970 | $184,400 | $67,600 | $116,800 |
| 2019 | $6,970 | $184,400 | $67,600 | $116,800 |
| 2018 | $6,882 | $184,400 | $67,600 | $116,800 |
| 2017 | $6,490 | $173,900 | $64,400 | $109,500 |
| 2016 | $6,490 | $173,900 | $64,400 | $109,500 |
| 2015 | $6,525 | $173,900 | $64,400 | $109,500 |
| 2014 | $6,714 | $173,900 | $64,400 | $109,500 |
| 2013 | $6,743 | $171,400 | $64,400 | $107,000 |
Source: Public Records
Map
Nearby Homes
- 10 Hoinski Way
- 2 Clifford Dr
- 5 Clifford Dr
- 27 Condon Dr
- 54 Northrop Rd
- 11 Sheasby Rd
- 120 Pulaski Hwy
- 151 Benz St
- 8 Fox Hill Terrace
- 1166 Old Racebrook Rd
- 14 Nancy Rd
- 59 Chestnut Dr
- 9 Tallwood Rd
- 195 Marshall Ln
- 4 Brook Rd
- 29 N Coe Ln
- 305 Rimmon Rd
- 25 Beechwood Dr
- 31 Cortland Place Unit 31
- 4 N Spring St