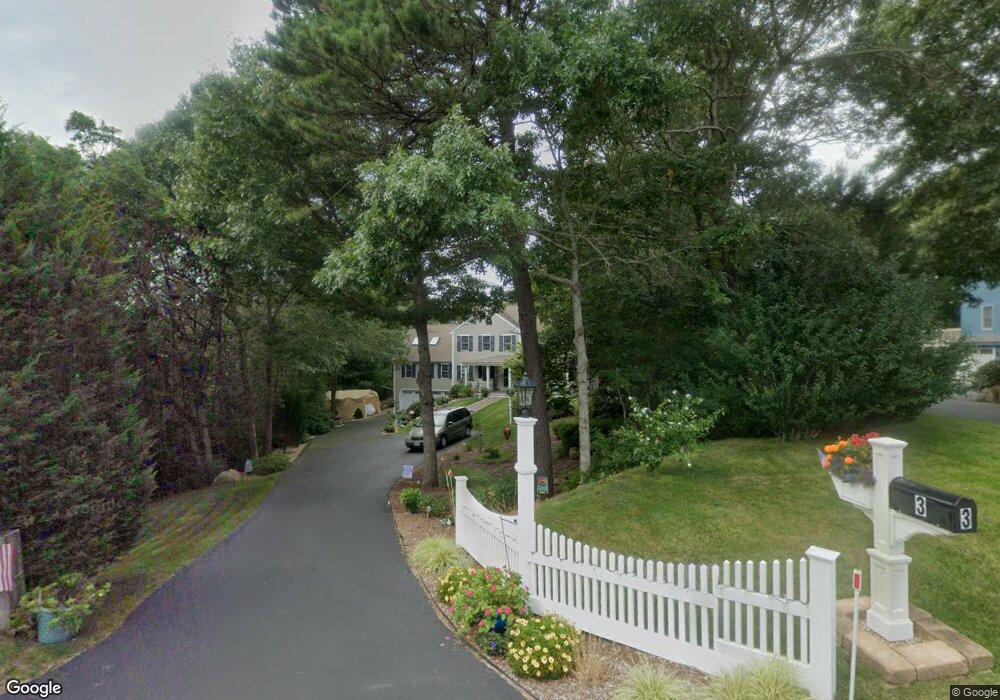
3 Foretop Rd Bourne, MA 2532
Estimated Value: $842,751 - $962,000
4
Beds
3
Baths
2,728
Sq Ft
$331/Sq Ft
Est. Value
About This Home
This home is located at 3 Foretop Rd, Bourne, MA 2532 and is currently estimated at $902,438, approximately $330 per square foot. 3 Foretop Rd is a home located in Barnstable County with nearby schools including Bourne High School, St Margaret Regional School, and Bridgeview Montessori School.
Ownership History
Date
Name
Owned For
Owner Type
Purchase Details
Closed on
Mar 19, 2024
Sold by
Savill Ronald G and Savill Elizabeth M
Bought by
Savill Lt and Savill
Current Estimated Value
Purchase Details
Closed on
Jun 19, 2008
Sold by
Snow Mary
Bought by
Savill Elizabeth M and Savill Ronald G
Home Financials for this Owner
Home Financials are based on the most recent Mortgage that was taken out on this home.
Original Mortgage
$265,000
Interest Rate
6.1%
Mortgage Type
Purchase Money Mortgage
Purchase Details
Closed on
Sep 13, 2002
Sold by
Browns Landing Land T and Browns Brown
Bought by
Snow Mary
Home Financials for this Owner
Home Financials are based on the most recent Mortgage that was taken out on this home.
Original Mortgage
$311,200
Interest Rate
6.48%
Mortgage Type
Purchase Money Mortgage
Purchase Details
Closed on
Jan 3, 2002
Sold by
Ehcsrop T T and Ehcsrop Nahigian
Bought by
Browns Lndg Land T and Browns Brown
Create a Home Valuation Report for This Property
The Home Valuation Report is an in-depth analysis detailing your home's value as well as a comparison with similar homes in the area
Purchase History
| Date | Buyer | Sale Price | Title Company |
|---|---|---|---|
| Savill Lt | -- | None Available | |
| Savill Lt | -- | None Available | |
| Savill Elizabeth M | $395,000 | -- | |
| Savill Elizabeth M | $395,000 | -- | |
| Snow Mary | $389,000 | -- | |
| Snow Mary | $389,000 | -- | |
| Browns Lndg Land T | $82,360 | -- | |
| Browns Lndg Land T | $82,360 | -- |
Source: Public Records
Mortgage History
| Date | Status | Borrower | Loan Amount |
|---|---|---|---|
| Previous Owner | Savill Elizabeth M | $265,000 | |
| Previous Owner | Snow Mary | $311,200 |
Source: Public Records
Tax History
| Year | Tax Paid | Tax Assessment Tax Assessment Total Assessment is a certain percentage of the fair market value that is determined by local assessors to be the total taxable value of land and additions on the property. | Land | Improvement |
|---|---|---|---|---|
| 2025 | $5,990 | $767,000 | $204,600 | $562,400 |
| 2024 | $5,905 | $736,300 | $194,800 | $541,500 |
| 2023 | $5,746 | $652,200 | $191,600 | $460,600 |
| 2022 | $5,430 | $538,200 | $169,500 | $368,700 |
| 2021 | $4,044 | $495,600 | $154,300 | $341,300 |
| 2020 | $5,226 | $486,600 | $152,800 | $333,800 |
| 2019 | $3,779 | $472,500 | $152,800 | $319,700 |
| 2018 | $3,447 | $454,200 | $145,600 | $308,600 |
| 2017 | $4,557 | $442,400 | $137,000 | $305,400 |
| 2016 | $4,422 | $435,200 | $137,000 | $298,200 |
| 2015 | $4,237 | $420,800 | $122,600 | $298,200 |
Source: Public Records
Map
Nearby Homes
- 24 Ships View Terrace
- 29 Weather Deck Rd
- 10 Sandy Ln
- 3 Honora Ln Unit 3
- 6 Honora Ct
- 60 Sandwich Rd
- 38 Old Bridge Rd
- 304 Main St
- 24 Heather Hill Rd
- 44 Cotuit Rd
- 58 Maple St
- 5 Sea Knoll Ct
- 4 Hollyhock Knoll Ct Unit 4
- 4 Hollyhock Knoll Ct Unit 4
- 46 Holt Rd Unit B
- 46 Holt Rd
- 5 Zoli Ln
- 2 Applewood Ct
- 13 Laurel Hill Ct
- 12 Turnberry Rd Unit 12
- 3 Foretop Rd
- 5 Foretop Rd
- 1 Weather Deck Dr
- 7 Foretop Rd
- 4 Foretop Rd
- 6 Weather Deck Rd
- 4 Foretop Rd
- 6 Weather Deck Dr
- 7 Foretop Rd
- 4 Weather Deck Rd
- 8 Weather Deck Rd
- 8 Weather Deck Dr
- 4 Weather Deck Dr
- 4 Weather Deck Dr
- 8 Weather Deck Dr
- 8 Foretop Rd
- 8 Foretop Rd
- 9 Foretop Rd
- 2 Weather Deck Dr
- 9 Foretop Rd
Your Personal Tour Guide
Ask me questions while you tour the home.