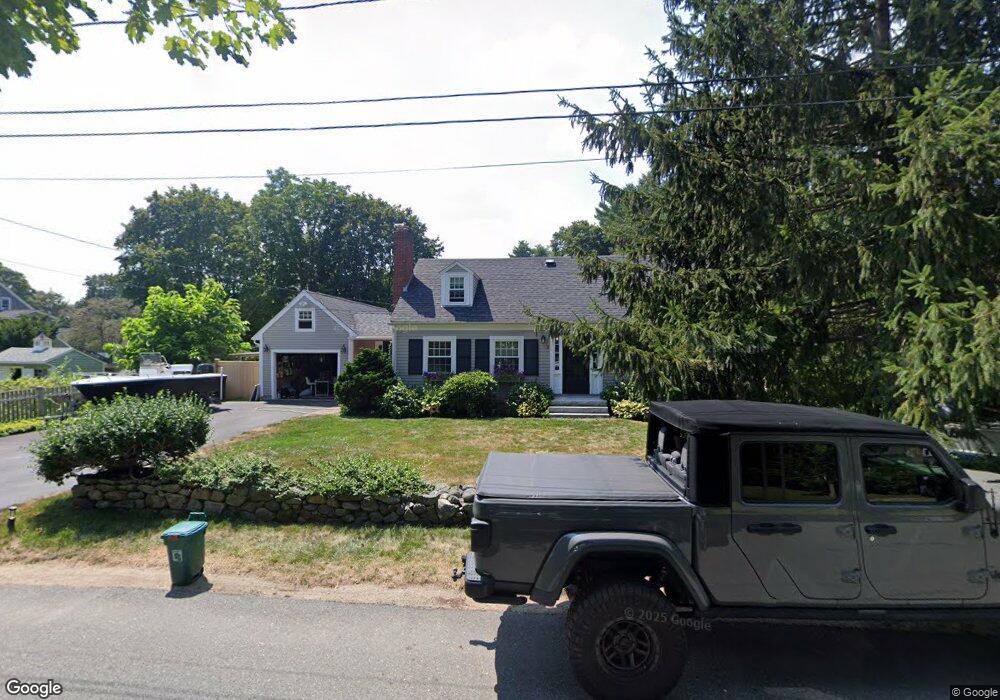
3 Foster St Wenham, MA 01984
Estimated Value: $888,952 - $971,000
4
Beds
2
Baths
1,796
Sq Ft
$517/Sq Ft
Est. Value
About This Home
This home is located at 3 Foster St, Wenham, MA 01984 and is currently estimated at $928,738, approximately $517 per square foot. 3 Foster St is a home located in Essex County with nearby schools including Winthrop School, Cutler Elementary School, and Miles River Middle School.
Ownership History
Date
Name
Owned For
Owner Type
Purchase Details
Closed on
Jun 19, 2014
Sold by
Clark 3Rd Remington A and Clark Lynn G
Bought by
3 Foster Wenham Rt and Clark Remington A
Current Estimated Value
Purchase Details
Closed on
Aug 1, 1984
Bought by
Clark Remington A and Clark Lynn G
Create a Home Valuation Report for This Property
The Home Valuation Report is an in-depth analysis detailing your home's value as well as a comparison with similar homes in the area
Home Values in the Area
Average Home Value in this Area
Purchase History
| Date | Buyer | Sale Price | Title Company |
|---|---|---|---|
| 3 Foster Wenham Rt | -- | -- | |
| Clark Remington A | $140,000 | -- |
Source: Public Records
Mortgage History
| Date | Status | Borrower | Loan Amount |
|---|---|---|---|
| Previous Owner | Clark Remington A | $193,500 | |
| Previous Owner | Clark Remington A | $195,680 | |
| Previous Owner | Clark Remington A | $212,000 |
Source: Public Records
Tax History Compared to Growth
Tax History
| Year | Tax Paid | Tax Assessment Tax Assessment Total Assessment is a certain percentage of the fair market value that is determined by local assessors to be the total taxable value of land and additions on the property. | Land | Improvement |
|---|---|---|---|---|
| 2025 | $11,621 | $747,800 | $446,800 | $301,000 |
| 2024 | $11,438 | $730,400 | $446,800 | $283,600 |
| 2023 | $11,886 | $685,100 | $475,200 | $209,900 |
| 2022 | $11,818 | $603,600 | $400,000 | $203,600 |
| 2021 | $11,277 | $573,000 | $369,400 | $203,600 |
| 2020 | $10,718 | $565,900 | $369,900 | $196,000 |
| 2019 | $10,198 | $565,900 | $369,900 | $196,000 |
| 2018 | $9,737 | $518,200 | $358,000 | $160,200 |
| 2017 | $9,499 | $518,200 | $358,000 | $160,200 |
| 2016 | $8,349 | $491,700 | $358,000 | $133,700 |
| 2015 | $7,990 | $491,700 | $358,000 | $133,700 |
Source: Public Records
Map
Nearby Homes