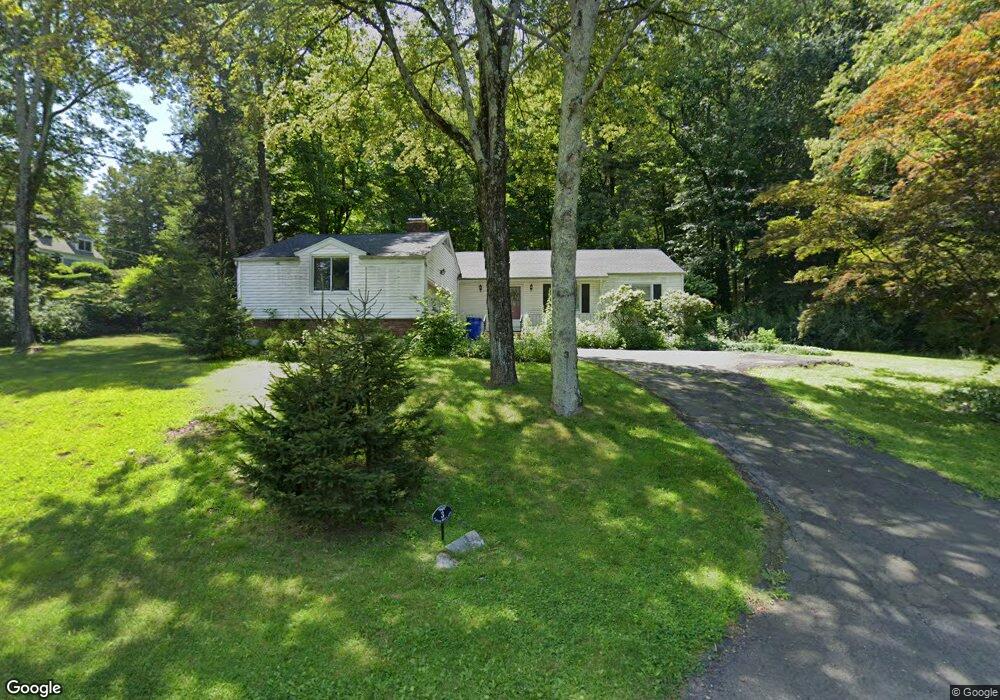
3 Fulling Mill Ln Ridgefield, CT 06877
Estimated Value: $810,633 - $1,072,000
6
Beds
2
Baths
1,710
Sq Ft
$535/Sq Ft
Est. Value
About This Home
This home is located at 3 Fulling Mill Ln, Ridgefield, CT 06877 and is currently estimated at $914,908, approximately $535 per square foot. 3 Fulling Mill Ln is a home located in Fairfield County with nearby schools including Farmingville Elementary School, Ridgefield High School, and Ridgefield Montessori School.
Ownership History
Date
Name
Owned For
Owner Type
Purchase Details
Closed on
Aug 3, 1998
Sold by
Frampton Michael P and Frampton Kathleen
Bought by
Greenfield Walter F and Greenfield Janet A
Current Estimated Value
Home Financials for this Owner
Home Financials are based on the most recent Mortgage that was taken out on this home.
Original Mortgage
$261,400
Interest Rate
6.75%
Mortgage Type
Unknown
Purchase Details
Closed on
May 23, 1991
Sold by
Lytton Glenn and Lytton Sandra
Bought by
Frampton Michael and Frampton Kathleen
Home Financials for this Owner
Home Financials are based on the most recent Mortgage that was taken out on this home.
Original Mortgage
$227,200
Interest Rate
3.5%
Mortgage Type
Unknown
Purchase Details
Closed on
Jan 7, 1988
Sold by
Ragolia Joseph
Bought by
Lytton Glenn
Create a Home Valuation Report for This Property
The Home Valuation Report is an in-depth analysis detailing your home's value as well as a comparison with similar homes in the area
Home Values in the Area
Average Home Value in this Area
Purchase History
| Date | Buyer | Sale Price | Title Company |
|---|---|---|---|
| Greenfield Walter F | $326,750 | -- | |
| Frampton Michael | $252,500 | -- | |
| Lytton Glenn | $301,000 | -- |
Source: Public Records
Mortgage History
| Date | Status | Borrower | Loan Amount |
|---|---|---|---|
| Open | Lytton Glenn | $340,400 | |
| Closed | Lytton Glenn | $261,400 | |
| Previous Owner | Lytton Glenn | $221,000 | |
| Previous Owner | Lytton Glenn | $227,200 |
Source: Public Records
Tax History Compared to Growth
Tax History
| Year | Tax Paid | Tax Assessment Tax Assessment Total Assessment is a certain percentage of the fair market value that is determined by local assessors to be the total taxable value of land and additions on the property. | Land | Improvement |
|---|---|---|---|---|
| 2025 | $10,173 | $371,420 | $236,250 | $135,170 |
| 2024 | $9,787 | $371,420 | $236,250 | $135,170 |
| 2023 | $9,586 | $371,420 | $236,250 | $135,170 |
| 2022 | $8,196 | $288,290 | $173,250 | $115,040 |
| 2021 | $8,133 | $288,290 | $173,250 | $115,040 |
| 2020 | $8,107 | $288,290 | $173,250 | $115,040 |
| 2019 | $8,107 | $288,290 | $173,250 | $115,040 |
| 2018 | $8,009 | $288,290 | $173,250 | $115,040 |
| 2017 | $6,647 | $244,290 | $133,050 | $111,240 |
| 2016 | $6,520 | $244,290 | $133,050 | $111,240 |
| 2015 | $6,354 | $244,290 | $133,050 | $111,240 |
| 2014 | $6,354 | $244,290 | $133,050 | $111,240 |
Source: Public Records
Map
Nearby Homes
- 137 Walnut Grove Rd
- 80 Lounsbury Ln
- 252 Florida Hill Rd
- 95 Ridgewood Rd
- 40 Hull Place
- 46 Tally Ho Rd
- 34 Hickory Ln
- 176 Picketts Ridge Rd
- 7 Honeysuckle Ln
- 15 Laurel Hill Rd
- 61 Marchant Rd
- 7 Elderberry Ln Unit 7
- 81 Picketts Ridge Rd
- 7 Guardhouse Dr
- 217 Danbury Rd
- 19 Prospect Ridge Unit 14
- 229 Umpawaug Rd
- 77 Sunset Ln Unit 223
- 59 Prospect St Unit C
- 52 Lawson Ln Unit 52
- 9 Fulling Mill Ln
- 19 Fulling Mill Ln
- 78 Saunders Ln
- 88 Cains Hill Rd
- 6 Fulling Mill Ln
- 8 Fulling Mill Ln
- 82 Saunders Ln
- 90 Cains Hill Rd
- 74 Saunders Ln
- 16 Fulling Mill Ln
- 27 Fulling Mill Ln
- 82 Cains Hill Rd
- 94 Cains Hill Rd
- 68 Saunders Ln
- 84 Saunders Ln
- 100 Cains Hill Rd
- 78 Cains Hill Rd
- 24 Fulling Mill Ln
- 72 Saunders Ln
- 77 Saunders Ln