Estimated Value: $322,000 - $345,000
2
Beds
2
Baths
2,230
Sq Ft
$150/Sq Ft
Est. Value
About This Home
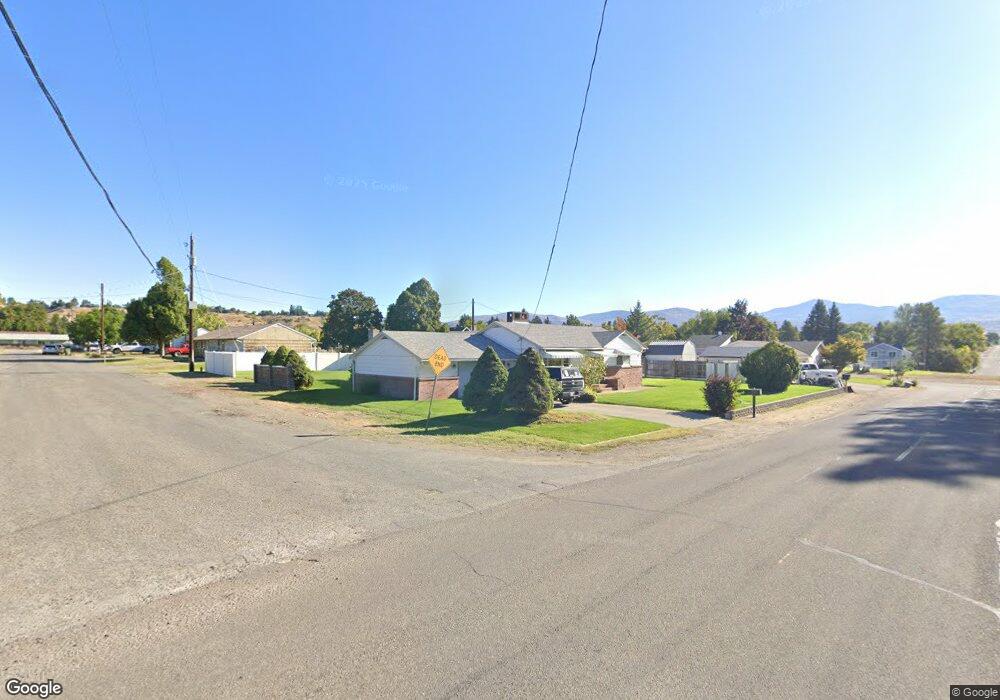
This home is located at 3 Grape Ave W, Omak, WA 98841 and is currently estimated at $333,512, approximately $149 per square foot. 3 Grape Ave W is a home located in Okanogan County with nearby schools including North Omak Elementary School, East Omak Elementary School, and Omak Middle School.
Ownership History
Date
Name
Owned For
Owner Type
Purchase Details
Closed on
Apr 17, 2019
Sold by
Barnell Carol
Bought by
Peterson Glen A
Current Estimated Value
Home Financials for this Owner
Home Financials are based on the most recent Mortgage that was taken out on this home.
Original Mortgage
$211,500
Outstanding Balance
$186,320
Interest Rate
4.4%
Mortgage Type
VA
Estimated Equity
$147,192
Purchase Details
Closed on
Apr 27, 2011
Sold by
Michelsen Phyllis
Bought by
Barnell Carol L
Home Financials for this Owner
Home Financials are based on the most recent Mortgage that was taken out on this home.
Original Mortgage
$20,000
Interest Rate
4.77%
Mortgage Type
Seller Take Back
Purchase Details
Closed on
May 23, 2005
Sold by
Mcculley Leroy F and Mcculley Dorothy
Bought by
Michelsen Phyllis
Create a Home Valuation Report for This Property
The Home Valuation Report is an in-depth analysis detailing your home's value as well as a comparison with similar homes in the area
Home Values in the Area
Average Home Value in this Area
Purchase History
| Date | Buyer | Sale Price | Title Company |
|---|---|---|---|
| Peterson Glen A | $217,565 | Wfg National Title | |
| Barnell Carol L | $180,000 | Inland Professional Title | |
| Michelsen Phyllis | $148,673 | None Available |
Source: Public Records
Mortgage History
| Date | Status | Borrower | Loan Amount |
|---|---|---|---|
| Open | Peterson Glen A | $211,500 | |
| Previous Owner | Barnell Carol L | $20,000 |
Source: Public Records
Tax History Compared to Growth
Tax History
| Year | Tax Paid | Tax Assessment Tax Assessment Total Assessment is a certain percentage of the fair market value that is determined by local assessors to be the total taxable value of land and additions on the property. | Land | Improvement |
|---|---|---|---|---|
| 2025 | $2,447 | $299,700 | $23,800 | $275,900 |
| 2024 | $2,447 | $290,500 | $23,800 | $266,700 |
| 2023 | $2,209 | $235,300 | $23,800 | $211,500 |
| 2022 | $2,229 | $207,700 | $23,800 | $183,900 |
| 2021 | $1,973 | $207,700 | $23,800 | $183,900 |
| 2020 | $1,926 | $169,500 | $23,800 | $145,700 |
| 2019 | $1,834 | $169,500 | $23,800 | $145,700 |
| 2018 | $2,021 | $150,500 | $23,800 | $126,700 |
| 2017 | $1,839 | $150,500 | $23,800 | $126,700 |
| 2016 | $1,813 | $150,500 | $23,800 | $126,700 |
| 2015 | $1,724 | $149,200 | $23,800 | $125,400 |
| 2013 | -- | $149,200 | $23,800 | $125,400 |
Source: Public Records
Map
Nearby Homes
- 709 Sunrise Dr
- 12 Dewberry Ave W
- 18 Cherry Ave W
- 215 E Dewberry Ave
- 519 Locust St
- 522 Locust St
- 129 N Cedar St
- 605 Bramble Ave
- 715 Locust St
- 2 Lot (Lot 2 Powers Sp) Duck Lake Rd
- 1 Lot (Powers Sp) Duck Lake Rd
- 4 Lot (Miller Rd Sp) Duck Lake Rd
- 3 Lot (Miller Rd Sp) Duck Lake Rd
- 604 Ross Canyon Rd
- 600 Ross Canyon Rd
- 14 Hahn Rd
- 28 Fir St N
- 319 Oak St
- 6 Valley View Park Dr
- 0 Asotin St S Unit NWM2460139