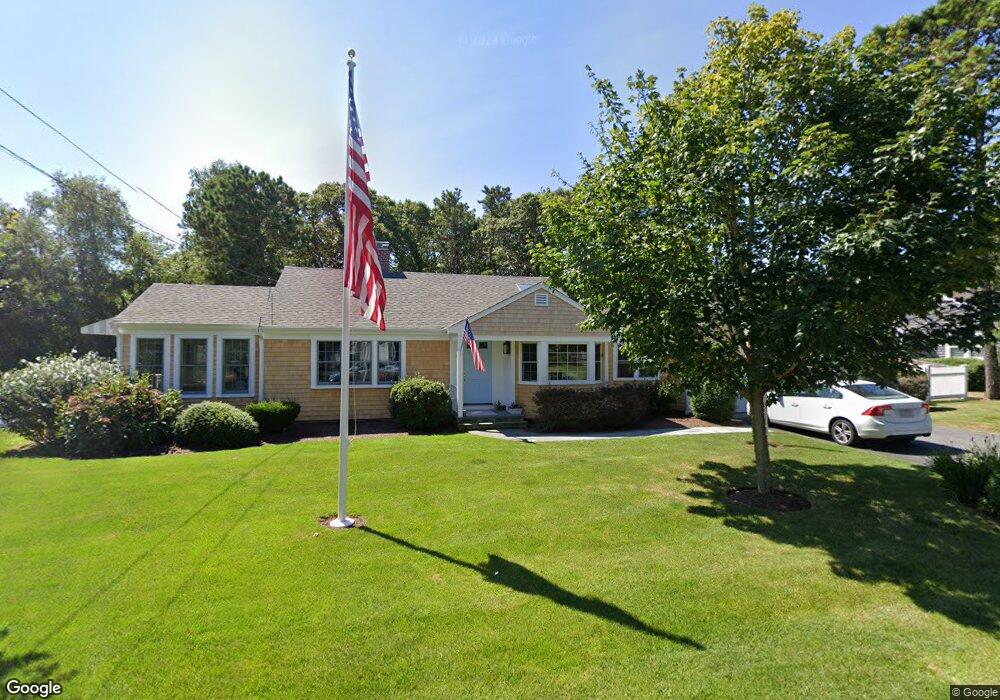
3 Herring Run West Harwich, MA 02671
Northwest Harwich NeighborhoodEstimated Value: $799,000 - $1,230,522
2
Beds
2
Baths
1,001
Sq Ft
$978/Sq Ft
Est. Value
About This Home
This home is located at 3 Herring Run, West Harwich, MA 02671 and is currently estimated at $978,881, approximately $977 per square foot. 3 Herring Run is a home located in Barnstable County with nearby schools including Harwich Elementary School, Chatham Elementary School, and Monomoy Regional Middle School.
Ownership History
Date
Name
Owned For
Owner Type
Purchase Details
Closed on
Apr 11, 2023
Sold by
Howard Paula B and Howard Robert G
Bought by
3 Herring Run Llc
Current Estimated Value
Purchase Details
Closed on
Apr 4, 2014
Sold by
Howard Paula B and Howard Robert G
Bought by
Howard Paula B and Howard Robert G
Purchase Details
Closed on
Jun 23, 2006
Sold by
Byrne Barbara J and Byrne James D
Bought by
Howard Paula B and Howard Robert G
Create a Home Valuation Report for This Property
The Home Valuation Report is an in-depth analysis detailing your home's value as well as a comparison with similar homes in the area
Home Values in the Area
Average Home Value in this Area
Purchase History
| Date | Buyer | Sale Price | Title Company |
|---|---|---|---|
| 3 Herring Run Llc | -- | None Available | |
| 3 Herring Run Llc | -- | None Available | |
| Howard Paula B | -- | -- | |
| Howard Paula B | -- | -- | |
| Byrne Barbara J | -- | -- | |
| Howard Paula B | -- | -- | |
| Byrne Barbara J | -- | -- |
Source: Public Records
Tax History Compared to Growth
Tax History
| Year | Tax Paid | Tax Assessment Tax Assessment Total Assessment is a certain percentage of the fair market value that is determined by local assessors to be the total taxable value of land and additions on the property. | Land | Improvement |
|---|---|---|---|---|
| 2025 | $6,443 | $1,090,200 | $592,800 | $497,400 |
| 2024 | $6,172 | $1,023,500 | $559,300 | $464,200 |
| 2023 | $5,965 | $898,400 | $508,400 | $390,000 |
| 2022 | $5,993 | $739,000 | $442,200 | $296,800 |
| 2021 | $5,720 | $665,100 | $402,000 | $263,100 |
| 2020 | $5,195 | $595,100 | $339,600 | $255,500 |
| 2019 | $4,916 | $567,000 | $326,300 | $240,700 |
| 2018 | $4,909 | $541,600 | $296,700 | $244,900 |
| 2017 | $4,503 | $502,000 | $270,400 | $231,600 |
| 2016 | $4,460 | $491,700 | $270,400 | $221,300 |
| 2015 | $4,259 | $474,800 | $250,800 | $224,000 |
| 2014 | $3,519 | $401,300 | $243,300 | $158,000 |
Source: Public Records
Map
Nearby Homes
- 64 Riverside Dr
- 3 Fairbanks Dr
- 24 Chase St
- 24 Chase St
- 148 Belmont Rd
- 43 Strandway
- 6 Bayberry Ln
- 1 Belmont Rd Unit 630
- 1 Belmont Rd Unit 542
- 1 Belmont Rd Unit 513
- 1 Belmont Rd Unit 19
- 5 Home Wood Ln
- 40 Willow St
- 73 Division St
- 1 Redwing Place Unit 1 & 3
- 79 Massachusetts 28
- 1 E Belmont Unit TH19
- 13 Osborne Rd
- 126 Massachusetts 28
- 161 Massachusetts 28 Unit 7